Download
1 / 15
150 likes | 265 Views
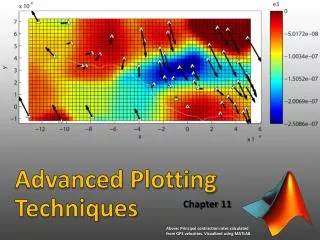
Plotting - Advanced. FPLOT. Plots a function f(x) written as a string within quotation marks. The free variable needs to be designated with x . The lower and upper limits for x are given as a row vector with two values, as the second argument of the function.

E N D
FPLOT • Plots a function f(x) written as a string within quotation marks. The free variable needs to be designated with x. • The lower and upper limits for x are given as a row vector with two values, as the second argument of the function. • Example: fplot('x.*sin(x)', [0 10*pi])
FPLOT example • Example of fplot:fplot('x.*sin(x)', [0 10*pi])
Logarithmic plotting • Many functions tend to increase exponentially after some point. This presents problems in viewing the behavior (or see the values) of the function where it is close to zero. • To accentuate low values and compress the high ones, the axis where the values get too high are plotted on a logarithmic scale. • In MATLAB, we can plot x-axis, y-axis, or both axes on a logarithmic scale.
Chart type: SEMILOGX • Example:x= e-t, y= t, 0≤t≤2 t= linspace(0, 2*pi, 200);x= exp(-t); y= t;plot(x,y); grid; t= linspace(0, 2*pi, 200);x= exp(-t); y= t;semilogx(x,y); grid;
Chart type: SEMILOGY • Example:y= e-x2, -3 ≤ x ≤ 3 x= linspace(-3, 3, 101);y= exp(-x.^2);plot(x,y); grid; x= linspace(-3, 3, 101);y= exp(-x.^2);semilogy(x,y); grid;
Chart type: LOGLOG • Example:x= e-t, y= 100 + e2t, 0 ≤ t ≤ 2 t= linspace(0, 2*pi, 200);x= exp(-t); y= 100+exp(2*t);plot(x,y); grid; t= linspace(0, 2*pi, 200);x= exp(-t); y= 100+exp(2*t);loglog(x,y); grid;
Chart type: POLAR • Plots a radial function around 360° • Example:r2= 2 sin 5t, 0 ≤ t ≤ 2t= linspace(0, 2*pi, 200);r= sqrt(abs(2*sin(5*t)));polar(t,r);
Chart type: FILL • Example:r2= 2 sin 5t, 0 ≤ t ≤ 2x= r cos t, y= r sin tt= linspace(0, 2*pi, 200);r= sqrt(abs(2*sin(5*t)));x= r.*cos(t); y= r.*sin(t);fill(x,y,'r');axis('square');
Chart type: BAR • Example:r2= 2 sin 5t, 0 ≤ t ≤ 2y= r sin tt= linspace(0, 2*pi, 200);r= sqrt(abs(2*sin(5*t)));y= r.*sin(t);bar(t,y);axis([0 pi 0 inf]);
Chart type: BARH • Example: World population by continentscont= char('Asia', 'Europe', 'Africa', 'N.America', 'S.America');pop=[3332; 696; 694; 437; 307];barh(pop);for i=1:5 gtext(cont(i,:));endxlabel('Population in millions');title('World population 1992');
Chart type: PIE • Example: World population by continentscont= char('Asia', 'Europe', 'Africa', 'N.America', 'S.America');pop=[3332; 696; 694; 437; 307];pie(pop);for i=1:5 gtext(cont(i,:));endtitle('World population 1992');
Chart type: COMET • Animated linear plot. Example: b= a sin a, 0 ≤ a ≤ 10a= linspace(0, 10*pi, 2000); b= a.*sin(a); pause(2); comet(a, b);
Multiple charts in a window • Multiple plots may be placed in a window using the SUBPLOT command. • Syntax: subplot(rows, columns, active) • Any plotting command acts on the active subplot only. • Active plot is selected in row-major order.
Multiple charts in a window • Example:x= linspace(0, 4*pi, 100); subplot(3,2,1); plot(x, sin(x));subplot(3,2,2); plot(2*x, sin(2*x));subplot(3,2,3); plot(x, cos(x));subplot(3,2,4); plot(2*x, cos(2*x));subplot(3,2,5); plot(x, tan(x));subplot(3,2,6); plot(2*x, tan(2*x));