Download
1 / 8
80 likes | 96 Views
This report provides insights into the annual growth and marketing spend by category, channels used in sponsorship, objectives in sponsorship evaluation, sponsorship spend by global region, metrics used to evaluate sponsorships, and the top 10 US sponsors.

E N D
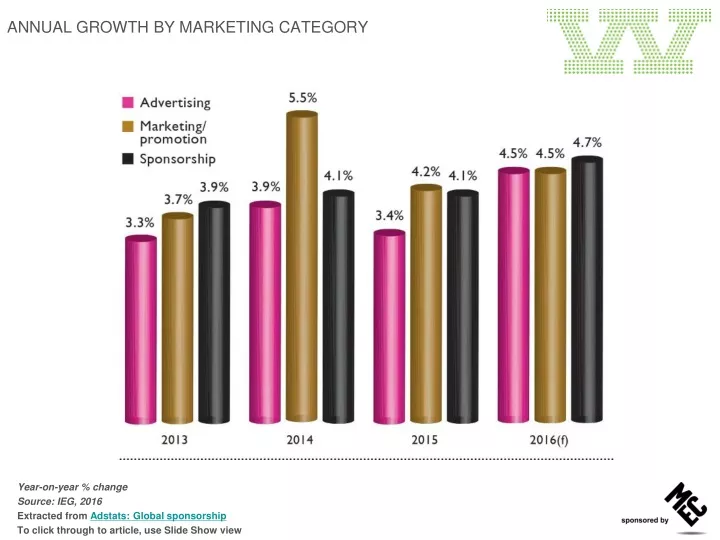
ANNUAL GROWTH BY MARKETING CATEGORY • Year-on-year % change • Source: IEG, 2016 • Extracted from Adstats: Global sponsorship • To click through to article, use Slide Show view
MARKETING SPEND BY CATEGORY • 2016(f), % share where total media and marketing spend is $965.1bn • Source: GroupM’s This Year, Next Year; December 2015 • Extracted from Adstats: Global sponsorship • To click through to article, use Slide Show view
CHANNELS USED IN SPONSORSHIP • % of respondents who ranked the factor a 9 or a 10 on a 10-point • scale, where 10 is extremely valuable • Source: IEG/ESP Properties 2015 Sponsorship Decision-Makers Survey • Extracted from Adstats: Global sponsorship • To click through to article, use Slide Show view
OBJECTIVES IN SPONSORSHIP EVALUATION • % of respondents who ranked the factor a 9 or a 10 on a 10-point • scale, where 10 is extremely valuable • Source: IEG/ESP Properties 2015 Sponsorship Decision-Makers Survey • Extracted from Adstats: Global sponsorship • To click through to article, use Slide Show view
SPONSORSHIP SPEND BY GLOBAL REGION • 2016(f), US$bn • Source: IEG, 2016 • Extracted from Adstats: Global sponsorship • To click through to article, use Slide Show view
NORTH AMERICA SPONSORSHIP SPEND BY CATEGORY • 2016(f), where total is US$22.4bn • Source: 2015; IEG • Extracted from Adstats: Global sponsorship • To click through to article, use Slide Show view
METRICS USED TO EVALUATE SPONSORSHIPS • % of respondents who ranked the factor a 9 or a 10 on a 10-point scale, where 10 is extremely valuable • Source: IEG/ESP Properties 2015 Sponsorship Decision-Makers Survey • Extracted from Adstats: Global sponsorship • To click through to article, use Slide Show view
TOP 10 US SPONSORS • 2014 (latest available), US$m, amount spent on sponsorship fees of US properties. Year-on-year % change in brackets • Source: 2015; IEG • Extracted from Adstats: Global sponsorship • To click through to article, use Slide Show view