Download
1 / 6
0 likes | 14 Views
Data science is an exciting field that combines statistics, programming, <br>and domain expertise to extract insights from data. This comprehensive <br>course will give you the skills to become a successful data scientist.

E N D
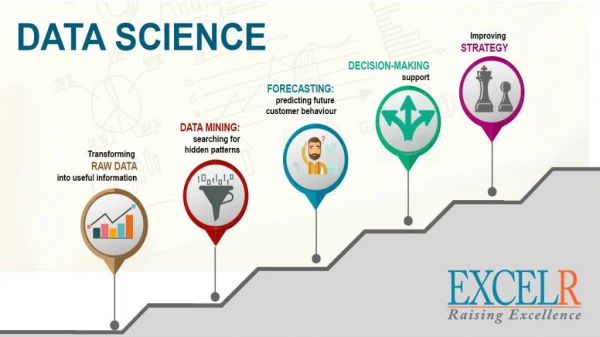
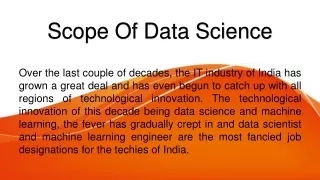
Introduction to Data Science Data science is an exciting field that combines statistics, programming, and domain expertise to extract insights from data. This comprehensive course will give you the skills to become a successful data scientist.
Overview of the Course Curriculum Fundamentals Hands-On Projects Industry Insights Dive into the core concepts of data science, including data collection, cleaning, and preprocessing. Apply your knowledge through real-world case studies and end-to-end data science projects. Learn from industry experts about the latest trends and best practices in data science.
Fundamentals of Python Programming 1 2 Python Basics Data Manipulation Master the fundamentals of Python syntax, data structures, and control flow. Leverage libraries like Pandas and NumPy for efficient data manipulation and analysis. 3 4 Machine Learning Data Visualization Explore popular machine learning algorithms and how to implement them in Python. Create stunning visualizations using libraries like Matplotlib and Seaborn.
Data Visualization Techniques Bar Charts Scatter Plots Line Graphs Histograms Effective for comparing categorical data. Useful for visualizing relationships between variables. Ideal for displaying trends over time. Provide insights into the distribution of data.
Career Opportunities in Data Science 1 Data Analyst Analyze data and uncover insights to support business decision-making. 2 Data Engineer Design and maintain data pipelines and infrastructure to support data-driven applications. 3 Data Scientist Develop and deploy machine learning models to solve complex business problems.
Contact Us Email Phone Address info@datadrix.com +91 – 9310936989 Delhi Branch : F 2/3 2nd Floor, Mrignayni Chowk, Dilshad Colony, Delhi - 110095