Download
1 / 76
950 likes | 1.53k Views
COMBUSTION DIAGNOSTICS – LIF. Dr. Jimmy Olofsson. Outline. Why combustion diagnostics? Molecular spectroscopy in brief Combustion LIF system Time-resolved Combustion LIF Coffee break Applications Related Techniques. Why combustion diagnostics?. Benefits of analysing combustion.

E N D
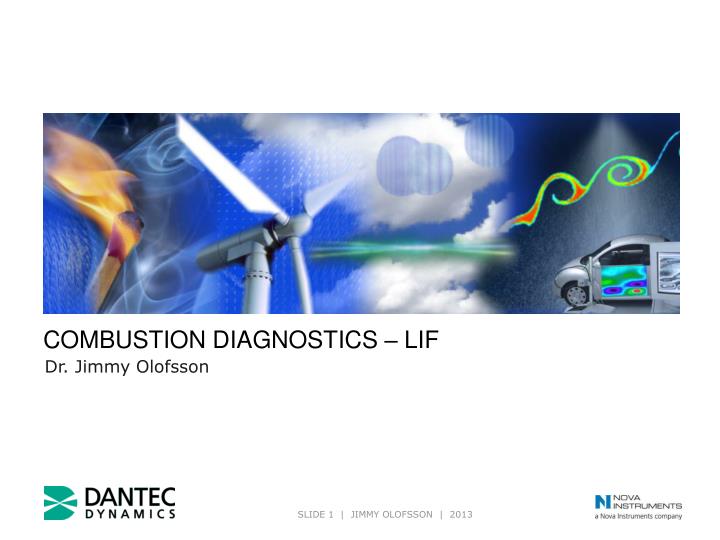
COMBUSTION DIAGNOSTICS – LIF Dr. Jimmy Olofsson
Outline • Why combustion diagnostics? • Molecular spectroscopy in brief • Combustion LIF system • Time-resolved Combustion LIF • Coffee break • Applications • Related Techniques
Benefits of analysing combustion Combustion related applications: Transportation Electrical power production Heating Combustion analysis can be used for economic as well as environmental benefits by: Optimizing fuel economy Improving performance and reliability Reducing pollutant emissions
Benefits of using lasers forcombustion diagnostics • Non-intrusive • High spatial resolution • High temporal resolution • High sensitivity • Species selective • 2D measurements Laser-based measurements techniques can provide information on species concentrations, temperature fields, flow velocities etc. and the measurements often have the following properties:
Combustion diagnostic techniques Combustion Radicals - LIF Soot LII Combined Measurements Fuel Tracer LIF Rayleigh Temperature
Combustion species Gas with chemical reactions Production of radicals Qualitative concentration of radical OH CH NO etc Concentration of larger molecules/tracers Formaldehyde Acetone etc
Excited Molecule Photon Fluorescence Emission Laser-Induced Fluorescence Excited State • Species selective measurements • (OH, formaldehyde, fuel tracers, etc.) Ground State Absorption
e- e- Molecular energy states: Electronic
OH absorption spectrumSeveral absorption lines around 283 nm Air Wavelengths Excitation in UV Wavelength (Å)
OH absorption spectrumTwo narrow absorbtion regions within 100 nm range ~283 nm 0.05 0.04 0.03 0.02 0.01 0.00 O–H Optical Density 240 260 280 300 320 340 360 Wavelength (nm)
Temperature dependence Choose a peak with for which the fluorescence is independent of temperature in the measured temperature range
Acetone absorption spectrumLarger molecules have wider absorption range 0.05 0.04 0.03 0.02 0.01 0.00 Optical Density 240 260 280 300 320 340 360 Wavelength (nm)
To excite atoms or diatomic molecules the laser wavelength must be precisely tuned to match molecular energy transition. Larger molecules, such as Acetone, 3-pentanone or Formaldehyde, have many more close-lying states, effectively making a wide continuous absorption band. Therefore, any wavelength within the absorption band can be used to excite the molecule. Selection of excitation wavelength
Laser-Induced Fluorescence Laser line 1,0 0,8 Detected LIF 0,6 Residual laser light 0,4 Wavelength /nm l 0,2 0 Bandpassfilter Fluorescence spectrum Absorption spectrum Normalised intensity 200 250 300 350 400 450 500 550 600
Combustion LIF system Image Intensifier UV Camera Lens Optical Filter CCD Camera Nd:YAG Laser Burner Sheet Optics Dye Laser
Standard Nd:YAG pumped dye laser 1090 mm 3ω/4ω 2ω Nd:YAG laser 250 mm Dye laser 744 mm Dye laser UV beams or 266nm or 355nm 250 mm Beam combining output bench 840 mm Nd:YAG laser • Single cavity 10 Hz • Wavelengths: 1064 nm, 532 nm, 355 nm, 266 nm • Pulse length ~10 ns • Pulse energy 400 mJ @ 532 nm Tuneable dye laser • Tunability range of fundamental: 380-750 nm • UV extension down to 200 nm • Line width: 0.8 cm-1 • Narrow band option: 0.08 cm-1
Tuning mirror • Grazing incidence grating • Beam expander prism (NBP Option) • Flowing dye cell • High reflectivity mirror • Focusing lens Tuneable dye laser oscillator Dye Laser
Species and excitation wavelengths Our refecence species which we use during the lab training
Light sheet forming optics Sheet height adjuster Beam waist adjuster Standard mount Holder & fixation system • Quartz optics for UV/visible transmission • Parallel light sheet • - Better control of reflections • - Enhanced energy distribution
Detecting Laser-Induced Fluorescence • Sensitive, high-resolution CCD camera CCD Camera • Image intensifier • Amplifies the incoming light • Converts UV fluorescence to visible light detectable by the CCD camera • Allows gated detection with very short time gates, to minimise detection of natural flame emission Image Intensifier UV Camera Lens Spectral Filter • UV camera lens required for detection of UV fluorescence • Spectral filter to eliminate detection of scattered laser light and flame emission
Interference filters are used to transmitt only in the wavelength interval of the fluorescence from the molecular species of interest, typically some few 10 nm All other wavelengths should ideally be blocket by the filter Optical filters
Combustion LIF: Software and timing • Synchronization unit • Analog Input option. Includes the A/D board and software add-on • Software: • DynamicStudio acquisition and processing software • Software add-ons for tracer LIF and combustion LIF
Laser control from the software Nd:YAG laser • Automatic detecion • Auto activation at Preview/Acquisition • Q-switch activation/de-activation during Preview/Acquisition • Interlock messages displayed in Log Tuneable Dye laser • Wavelength set • Wavelength fine-tune buttons • Wavelength scan • Output wavelength calculated from fundamental depending on frequency conversion scheme
Framing rate requirements EXAMPLE • Heat release event in combustion engine running at 1200 rpm. • The main heat release occurs within ~5CAD out of the entire 360CAD engine cycle. • Resolution used in the study: 0.5CAD • This corresponds to a 14kHz Time-resolved Formaldehyde LIF J.Olofsson et al SAE 2005
High-speed Nd:YLF laser Output pulse energy (527 nm) vs repetition rate (single cavity laser)
Pulse separation: 75 µs Rep. Rate: 13kHz Pumping of dye lasers Pumping of a dye laser with high repetition rate causes two major problems: • Decrease in pulse energy • Deterioration of beam profile
TR C-LIF: YAG-based pump lasers IS Series • Repetition rate up to 10kHz • Pulse length: ~10ns • Pulse energy @ 4kHz: 8mJ HD Series • Repetition rate up to 10kHz • Pulse length: ~10ns • Pulse energy @ 10kHz: 12mJ • Pulse energy @ 5kHz: 20mJ
TR C-LIF: Dye laser Example: Pumping with 12W @ 1kHz => 12mJ / pulse Dye: Rhodamine 6G (~570nm) gives 3.3mJ / pulse Frequency doubling to ~283nm for OH LIF is estimated to give ~0.5mJ / pulse This should be compared with the corresponding ~20mJ / pulse achieved by the standard 10Hz system!
COMBUSTION DIAGNOSTICS – APPLICATIONS Dr. Jimmy Olofsson
Scalar imaging applications Gaseous flows (non reactive) Gaseous flows (reactive) Liquid flows Applications Mixing and heat transfer Pre- / Post-combustion Combustion Hardware Nd:YAG Laser Image intensifier unit Tuneable Dye Laser
Fuel Tracer-LIF Two different approaches to fuel visualization • ”Real” fuels • Real engine conditions • Unknown fluorescent properties (temperature, pressure, quenching etc.) • Non-fluorescing reference fuel with added fluorescent tracer • Well-known fluorescent properties • Allows for quantification • Further from real engine conditions
Acetone fluorescence spectrum Formaldehyde fluorescence spectrum A: in a flame B: in an engine Fluorescent tracer spectra
How to acheive homogeneous Acetone concentration for calibration Example: Quantification of fuel vapour in constant pressure vessel using liquid fuel “Iso-octane was used as substitute of real gasoline in PLIF experiment and 10% acetone was added in as tracer.” … “To get a homogeneous mixture, a small amount of fuel was injected into vessel. Waited about 30 seconds for vaporization, then, recorded 100 LIF signal images. After averaged the images and subtracted the background, the result gave the relationship between current equivalence ratio and the LIF signal.” Tsinghua University Beijing, China
Formaldehyde visualization in anHCCI engine Homogeneous Charge Compression Ignition Engine Advantages • Lower NOx levels and less soot formation compared to the Diesel engine • Higher part load efficiency compared to the SI engine Disadvantage • Difficult to control ignition timing For some fuels formaldehyde is formed in the cool-flame region J.Olofsson et al SAE 2005
Formaldehyde LIF in an engine High-speed laser Field-of-view Wavelength: 355 nm Fuel: N-Heptane J.Olofsson et al SAE 2005
Cycle-resolvedFormaldehyde consumption Single-cycle-resolved formaldehyde fluorescence imaged with a time separation of ~70 µs (0.5 CAD). J.Olofsson et al SAE 2005