Download
1 / 23
230 likes | 246 Views
This study explores the correlation of cell cycle expression patterns in F2 islets of mice, stratified by insulin, glucose levels, and other factors related to diabetes. Is there a link between cell cycle gene expression and diabetes development? The research delves into the role of specific genes in regulating cell cycle progression within islets. The study identifies genetic linkages, eQTLs, and co-expression modules related to cell cycle regulation in female F2 islets. Genome-wide mapping of key cell cycle genes in F2 islets helps identify potential genetic "hot spots" influencing various traits.

E N D
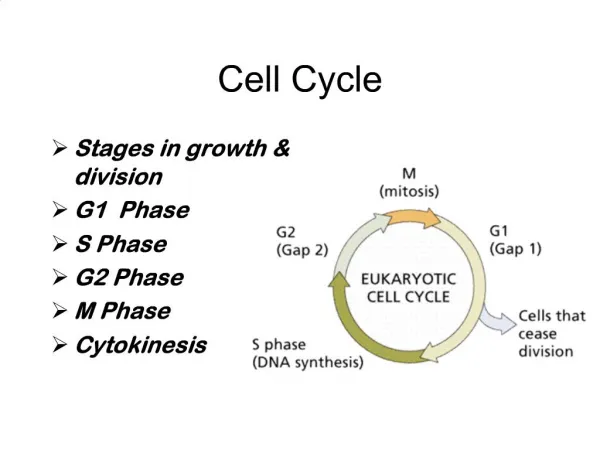
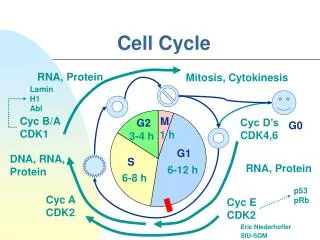
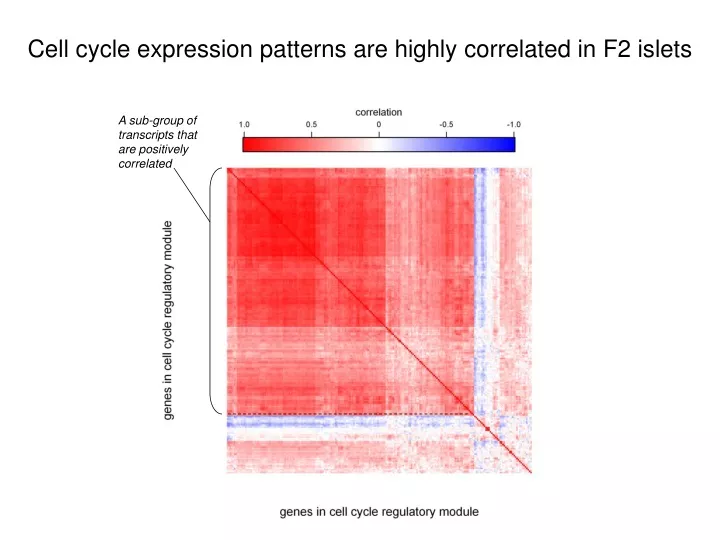
A sub-group of transcripts that are positively correlated Cell cycle expression patterns are highly correlated in F2 islets
A sub-group of transcripts that are positively correlated F2 mice are stratified by cell cycle expression patterns lower insulin higher glucose lower # islets higher TG lower body weight lower c-peptide “non-diabetic” “diabetic”
Distribution of a few cell cycle genes in F2 islets Is this difference in the expression of cell cycle genes sufficient to play a role in causing diabetes in the F2 mice?
Islet genes with “Regulation of progression through cell cycle” GO term Genome-wide linkage of cell cycle regulatory transcripts
Adipose genes with “Regulation of progression through cell cycle” GO term Genome-wide linkage of cell cycle regulatory transcripts
Islet genes with “Regulation of progression through cell cycle” GO term eQTL linkage on Chr 2 for cell cycle genes in islet
Islet genes with “Regulation of progression through cell cycle” GO term eQTL linkage on Chr 2 for cell cycle genes in islet
Islet genes with “Regulation of progression through cell cycle” GO term cis and trans eQTLs on Chr 2 for cell cycle regulation Gene Chr Mb Cdk5rap1 2 153.8 E2f1 2 154.0 Rbl1 (p107) 2 156.6 Igf2 7 137.1 Aip 19 39.0 LOD
Ccnh Cdkn2b Ccnd1 Strong cell cycle linkages occur across the genome Pdgfb Foxa2 Cdk3 Rb1 Ccnk LOD
body wt. # transcripts (divided by 20) with eQTL lod > 2
cell cycle module Co-expression modules identified in female F2 islets F2 female islet network MDS plot
Expression heat map for female F2 islets ~7500 transcripts in 14 modules cell cycle 228 female F2 mice
Cell cycle genes common in time course and F2 female islet modules
Genome-wide mapping of cell cycle gene set in F2 islets Nfx1 nuclear transcription factor, x-box binding 1 Chr 4, 41.1 Mb Prc1 protein regulator of cytokenesis 1 Chr 7, 80.1 Mb LOD Nrm nurim Chr 17, 35.4 Mb
LOD rescaled for each transcript, p-value threshold = 0.05 Genome-wide mapping of cell cycle gene set in F2 islets
LOD rescaled for each transcript, p-value threshold = 1.0 (will include all traits) Genome-wide mapping of cell cycle gene set in F2 islets
LOD rescaled for each transcript, p-value threshold = 1.0 (will include all traits) Mapping of cell cycle gene set in F2 islets to putative “hot spots”
LOD not rescaled for each transcript p-value threshold = 1.0 (will include all traits) Mapping other modules in female F2 islets F2 female islet network