Download
1 / 17
270 likes | 573 Views
Parametric & Non-parametric. Parametric. Ø A parameter to compare Mean, S.D. Normal Distribution & Homogeneity. Non-Parametric. Ø No parameter is compared Significant numbers in a category plays the role Ø No need of Normal Distribution & Homogeneity

E N D
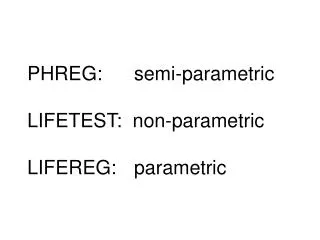
Parametric & Non-parametric Parametric • ØA parameter to compare • Mean, S.D. • Normal Distribution & Homogeneity Non-Parametric ØNo parameter is compared Significant numbers in a category plays the role ØNo need of Normal Distribution & Homogeneity ØUsed when parametric is not applicable.
Parametric & Non-parametric Parametric Vs Non-parametric Which is good ? If parametric is not applicable, then only we go for a non-parametric Both are applicable, we prefer parametric. Why? In parametric there is an estimation of values. Null hypothesis is based on that estimation. In non-parametric we are just testing a Null Hypothesis.
Normality ? How do you check Normality ? ØThe mean and median are approximately same. ØConstruct a Histogram and trace a normal curve. Example ?Level of Significance / p-value / Type I error / α ? Degree of Freedom
Types of variables Independent variable Dependent variable Data representation Continuous or Scale variable Discrete variable Nominal Ordinal (Categorical)
Paired t-test Areas of application >> When there is one group pre & post scores to compare. >> In two group studies, if there is pre & post assessment, paired t is applied to test whether there is significant change in individual group. S = S.E. = t = S.E. Example
Unpaired/independent t-test Areas of application >> When there is two group scores to compare. (One time assessment of dependent variable). >> In two group studies, if there is pre & post assessment, paired t is applied to test whether there is significant change in individual group. After this, the pre-post differences in the two groups are taken for testing. Example
ANOVA Areas of application >> When there is more than two group scores to compare. Group A x Group B x Group C Post-HOC procedures after ANOVA helps to compare the in-between groups A x B , A x C , B x C Similar to doing 3 unpaired t tests Example
Wilcoxon Matched Pairs A Non-parametric procedure >> This is the parallel test to the parametric paired t-test • Before after differences are calculated with direction + ve or –ve • 0 differences neglected. • Absolute differences are ranked from smallest to largest • Identical marks are scored the average rank • T is calculated from the sum of ranks associated with least frequent sign • If all are in same direction T = 0 Example
Mann Whitney U A Non-parametric procedure >> This is the parallel test to the parametric unpaired t-test • Data in both groups are combined and ranked • Identical marks are scored the average rank • Sum of ranks in separate groups are calculated • Sum of ranks in either group can be considered for U. • n1 is associated with ∑R1i , n2 is associated with ∑R2j Example
Median Test A Non-parametric procedure Similar to the cases of Mann Whitney >> This is the parallel test to the parametric unpaired t-test • Data in both groups are combined and median is calculated • Contingency table is prepared as follows
KruskalWalis A Non-parametric procedure >> This is the parallel test to the parametric ANOVA >> ANOVA was an extension of 2-group t-test >> KruskalWalis is an extension of Mann Whitney U • Data in all groups are combined and ranked • Identical marks are scored the average rank • Sum of ranks in separate groups are calculated Areas of application Example >> Areas similar to ANOVA >> Comparison of dependent variable between categories in a demographic variable
Mc Nemar’s Test Areas of application >> Similar to the parametric paired t-test, but the dependent variable is discrete, qualitative.
Contact Email : Web : Mobile : vipinxavier@rediffmail.com www.statidimensions.com 9495524446