Download
1 / 12
130 likes | 371 Views
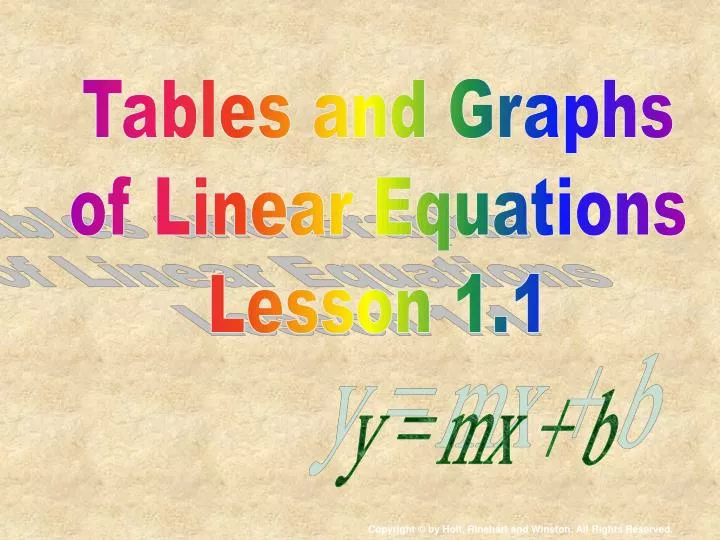
Tables and Graphs of Linear Equations Lesson 1.1. y = mx + b. 1.1 Tables and Graphs of Linear Equations. Objectives. Represent a real-world linear relationship in a table, graph, or equation. Identify linear equations and linear relationships between variables in a table. Glossary Terms.

E N D
Tables and Graphs of Linear Equations Lesson 1.1 y = mx + b
1.1 Tables and Graphs of Linear Equations Objectives • Represent a real-world linear relationship in a table, graph, or equation. • Identify linear equations and linear relationships between variables in a table. Glossary Terms • linear equation - an equation that can be represented by the equation y = mx + b • linearly related - if a relationship between x and y can be written as y = mx + b, then x and y are linearly related.
Suppose you work part-time in a music store. You earn $40 per week plus a 10% commission on all of the sales you make. Represent the relationship between weekly sales and weekly wages by making a table. Investigating Commission
Investigating Commission 60 70 80 90
Investigating Commission • What observations can you make about successive entries in the weekly sales column? weekly wages column? • Represent each row in the table as an ordered pair (s,w). Plot each ordered pair on a graph with s as the horizontal axis and w as the vertical axis. Connect the first and last points. Are all of the points collinear? • Write an equation to represent the relationship between s and w.
Successive entries of sales increase by a constant amount of $100. Successive entries of wages increase by a constant amount of $10. This is linear. Each point is on the line. 80 w = 0.10s + 40 Weekly wages 60 40 20 500 400 200 300 100 Weekly sales
Example 1 An attorney charges a fixed fee of $250 for an initial meeting and $150 per hour for all hours worked after that. a. Make a table of the total charge for 1, 2, 3, and 4 hours worked. b. Graph the points represented by your table and connect them. c. Write a linear equation to model this situation. d. Find the charge for 25 hours of work.
Try This A water tank already contains 55 gallons of water when Darius begins to fill it. Water flows into the tank at a rate of 9 gallons per minute. a. Make a table for the volume of water in the tank after 1, 2, 3, and 4 minutes. b. Graph the points represented by your table and connect them. c. Write a linear equation to model this situation. d. Find the volume of water in the tank after 20 minutes.
Try This - solution b. a. d. 9(20) + 55 = 235 c. V = 9t + 55 where V = volume and t = time in minutes
Try This - Again • A plumber charges a base fee of $55 for a service call plus $35 per hour for all hours worked during the call. • Make a table for the total charges after 1, 2, 3, and 4 hours worked. • Graph the points represented by your table and connect them • Write a linear equation to model this situation • Find the charge for 5 hours of work.
Try This - solution b. a. d. 35(5) + 55 = 230 c. c = 35h + 55 where c is the total charge and h is the number of hours worked.
Graph y = (2/3)x - 1 Example 2 The equation is in the form y = mx + b. First plot the y-intercept at (0, -1) Since two points determine a line, find another point by choosing a value for x and evaluating y. Example If x = 3, then (2/3)(3) - 1 = 1. Plot (3,1) Draw a line through the two points.