Download
1 / 11
120 likes | 295 Views
Chapter 3- Model Fitting. Three T asks W hen A nalyzing D ata:. Fit a model type to the data. Choose the most appropriate model from the ones that have been fitted. Make predictions based on the data. Project Outline:.

E N D
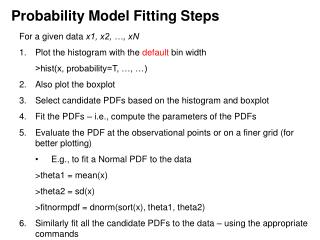
Three Tasks When Analyzing Data: • Fit a model type to the data. • Choose the most appropriate model from the ones that have been fitted. • Make predictions based on the data.
Project Outline: • Seven day window during which I eliminated carbohydrates from my diet as much as possible and tracked resultant weight changes. • Plotted the data and estimated a visual model to fit the data. • Calculated a model to fit the data using the Least Squares method.
Sources of Error in the Modeling Process • Formulation Error - Assumption that certain variables are negligible or simplifying the interrelationships among variables in the submodels. • Truncation Error - Comes from the numerical methods used to solve mathematical problems, such as truncated a series. • Round-off Error – Occurs because all numbers cannot be represented exactly using only finite representations, such as 1/3 equaling 0.33. • Measurement Error – Caused by imprecision in data collection.
Visual Model Fitting with the Original Data • Fit a line to attempt to minimize the absolute deviation, often this method is compatible with the accuracy of the modeling process.
Goal • In order to form a model that can be used to accurately make predictions based on the data, we must determine the parameters of a function y = f (x) using a collection of points (xi , yi) that minimizes the absolute deviations (R2).
Least Squares Method • Let Ri = |yi – f(xi)|2 for i = 1,2,3,4,5,6,7. • Since we are fitting a straight line a model of the form y = mx + b is expected, which requires minimizing : • The two partial derivatives must equal zero:
Least Squares Method (Con’t.) • Simplify the derivative to give the two formulas: • With manipulation we can set the two equations equal to a and b respectively, making it easy to determine the slope and intercept.
Result • Function y = f(x) that minimizes R, y = -0.429 + 151.36
Visual Estimate vs. Calculated Model Estimated Calculated