Download
1 / 32
320 likes | 447 Views
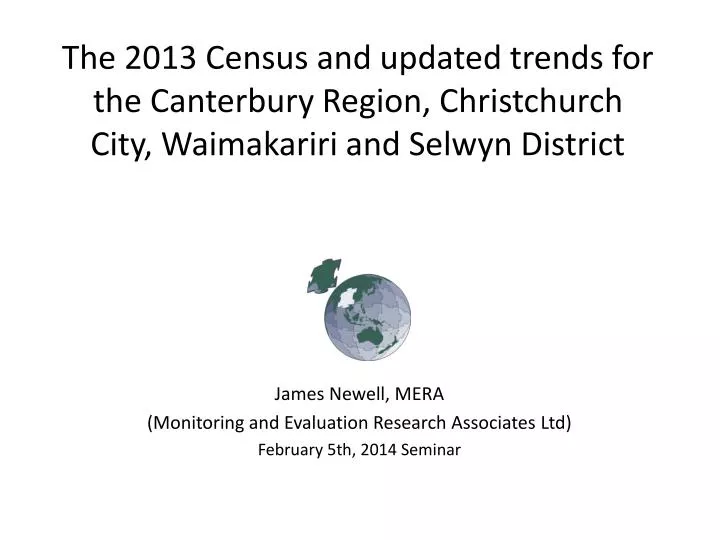
The 2013 Census and updated trends for the Canterbury Region, Christchurch City, Waimakariri and Selwyn District. James Newell, MERA ( Monitoring and Evaluation Research Associates Ltd) February 5th, 2014 Seminar. Outline. Overall population growth rates in context

E N D
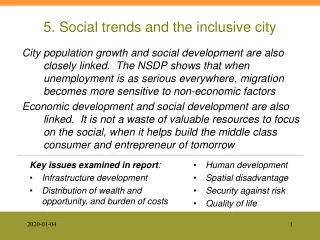
The 2013 Census and updated trends for the Canterbury Region, Christchurch City, Waimakariri and Selwyn District James Newell, MERA (Monitoring and Evaluation Research Associates Ltd) February 5th, 2014 Seminar
Outline • Overall population growth rates in context • Working with the 2013 census … • Net Migration • Internal migration flows by age • External (International) Migration flows update • (Communities …?) • Online statistics on the Christchurch recovery..
SNZ Estimated % change in usually resident population – June Yrs – 2007-2013
Working with the census • Census 2013 = cross section • … analyse trends over time to interpret and project • Eg. 1981, 1986, 1991, 1996, 2001, 2006, 2013 • … need to reconcile metadata • Geographies • classifications • Combine successive census results • What do the current census results mean in the context of long term trends • Inform credible for future migration assumptions scenarios and corresponding projection scenarios
Migration – an indicator of population redistribution and key driver of population projections • Key assumption – driver – migration • Last census provides key evidence of recent migration behaviour • Processes are scale and level as well as age and sex… dependent • Different migration processes at different levels – GtrChch, TLA and within TLA • Include residential capacity / demand behaviour assumptions at suburb level .. • Translate population in numbers of households / dwellings • Project future migration assumptions • base on a long term view • accounting for cyclical and one off events (eg. Earthquake effects)
Problems – the 7 yr gap – challenges for estimating migration movements .. • Census uses the question – what was your residential address five years ago (assumed to be the time of the previous census) • Designed to sync with the five year period since the last census • But it is now 7 years since the last census • It will generate some headaches in preparing estimates of trends in migration flows and migration rates – as needed to do new population projections • Statistics NZ 2013 census based projections at TLA level will be in late 2014 and into 2015 for more localised suburb level projections
Analysing trends …Migration Transitions by Greater Chch TLA and aggregated age group1976 … 2013
Working census migration – migration transitions • Migration address five years ago – provides a statistic on migration transitions between successive years … • What do the current migration results represent in the context of long term trends • What is period specific (eg EQ effects), what is long term trends of change, what are likely future migration transition rates • Evidence towards setting credible for future migration assumptions and corresponding projection scenarios
Census 2013 Migration data • It is complex– different processes at area unit, TLA, Regional and National Levels • Integrate those early 2013 Census results into a time series with results from previous census • Time series a TLA by TLA by 5 yr age and sex • Aggregate /select data from 2013 stats and legacy time series to a coherent time series on a common basis
Christchurch to Selwyn DistrictNet Migration Flows by Age & Period
Christchurch to Waimakariri DistrictNet Migration Flows by Age & Period
Common Indicators … • Leeds / Business Demographic data • Building permits • External Migration • Vitals – births and deaths • School rolls • PHA enrolments • Health statistics
Greater Christchurch - Long Term International Migration – 12 mth moving average
Other NZ - Long Term International Migration – 12 mth moving average
Which Country Group are the additional External Migrants coming from?
Effect of the Chch EQ on international long term migration flows – to date • Comparing relative rates of international long term migration – Chchvs North Island … • Differential migration arrivals / departures for Chch • Decreased departures effect peaked in December 2012 – April 2013 • Increase in arrivals has been peaked over Feb 2013 to July 2013 (Sept 2013 effect small…)
Estimate change in population of Greater Christchurch from Long Term International Migration effect of the EQ
Recovery Momentum : Number of Residential Building Consents – by Month to August 2013
Recovery Momentum : Number of Residential Building Consents – 12mths moving average by Month to August 2013
Spatial scales and change in Greater Christchurch– large localised changes in population size and composition at community level
Effects of the EQ on population change at different scales … • At Greater Christchurch level • Moderate population loss and subsequent recovery • At TLA level • More dramatic effects – especially intense increased development pressure and growth Selwyn District, some population loss for Christchurch City … • At suburb / community level • Very large rapid changes – increase and decreases within each TLA – community rebuilding / adaptation
Greater Christchurch – Years 1 to 5 of schooling (roughly 5-9 year olds)
Waimakariri & Selwyn Wards– Years 1 to 5 of schooling (roughly 5-9 year olds)
Christchurch City 2013 Wards– Years 1 to 5 of schooling (roughly 5-9 year olds)
Ethnicity and change in Greater Christchurch- different types, scale, distribution and timing of change for different ethnic communities
Maori Ethnicity - Year of Schooling 1 – 5 : Chch City by Ward
Pasifika Ethnicity - Year of Schooling 1 – 5 : Chch City by Ward
Asian Ethnicity - Year of Schooling 1 – 5 : Chch City by Ward
Some progress – and looking forward • A TLA Migration time series summary by broad age group : 1976 – 2013 • An NZ TLA2013 time series by 5 yr age and sex 1981 – 2013 • An NZ 2006/2013 Area Unit time series • Testing a web html based knowledge base prototype …