Download
1 / 22
220 likes | 305 Views
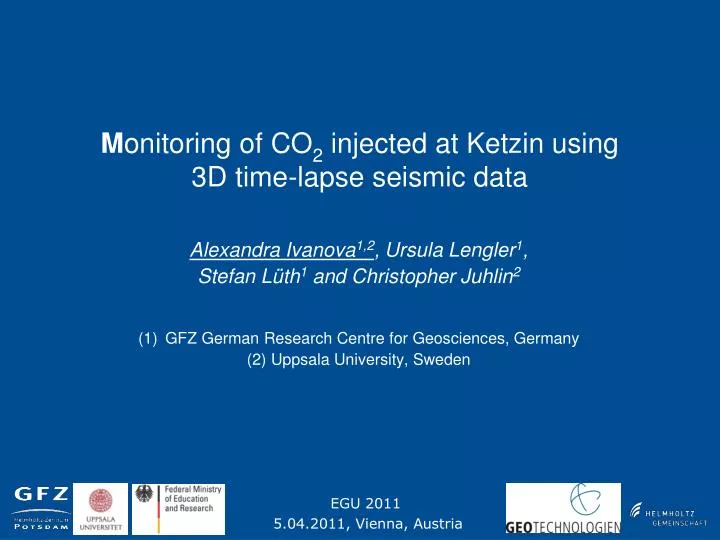
M onitoring of CO 2 injected at Ketzin using 3D time-lapse seismic data. Alexandra Ivanova 1,2 , Ursula Lengler 1 , Stefan Lüth 1 and Christopher Juhlin 2 GFZ German Research Centre for Geosciences, Germany (2) Uppsala University, Sweden. EGU 2011 5.04.2011, Vienna, Austria.

E N D
Monitoring of CO2 injected at Ketzin using3D time-lapse seismic data Alexandra Ivanova1,2, Ursula Lengler1, Stefan Lüth1 and Christopher Juhlin2 GFZ German Research Centre for Geosciences, Germany (2) Uppsala University, Sweden EGU 2011 5.04.2011, Vienna, Austria
CO2 Pilot Site observation well Ktzi 202 injection well Ktzi 201 observation well Ktzi 200 injection facility
Geologyof Ketzin Structural model V0Caprock V1Aquifer V2 V0Auitard
Geologyof Ketzin Structural model V0Caprock V1Aquifer V2 V0Auitard
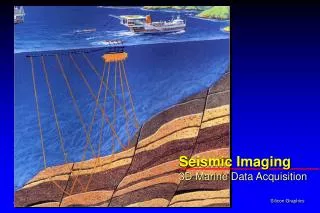
3D Baseline 2005: 41 Templates ~14km2 3D Repeat 2009: 20 Templates (after ~20 kilotons CO2 injected) 1 Template: 5 lines, 240 geophones 12 lines, 180 shotpoints Start of acquisition 2009: 25 Sep 2009 Last shotpoint: 6 Nov 2009 3D Repeat Survey Ketzin
Repetability 2005 baseline 2009 repeat
Processing steps applied to 3D repeat compared with the original flow
Amplitude change anomaly over the CO2 injection site low fold area for anomaly max change in amplitude ~ amplitude of K2 reflection anomaly ~ centered on injection well positive polarity
VOLUMETRICS • Volumetric estimation of mass of the injected CO2 visible in seismic data will be performed using • - average values of CO2 saturation in reservoir obtained for every well of the Ketzin site with • a) Pulsed Neutron-Gamma Well Logging; • b) Multiphase Flow Modeling; • - average CO2 density calculated with • a) measured temperature and pressure in reservoir at the injection site (in the injection well) to the time of the repeat survey; • b)from Multiphase Flow Modeling for every well of the Ketzin site. • Results show that we can see approximately the same quantity of the injected CO2 in the time-lapse seismic data : • a) Pulsed Neutron-Gamma Well Logging (~ 94%); • b) Multiphase Flow Modeling (~91%).
Time Differencefor CDP bin Push-Down Effect: dt = 2h * (1/v2 – 1/v1) => thickness h of CO2plume v1 v2
Distribution of CO2from 3D time-lapseobservaons: a) PNG Well Logging Mass ofinjected CO2 : Max Min Min Max . . Repeat Survey Beginning : 22.1 kTons Repeat Survey End: 24.2 kTons . . 20.5 kTons 23 kTons 20 kTons 22.1 kTons b) Multiphase Flow Modelling Min Max Min 20.5 kTons 23 kTons Min Mass ofinjected CO2 : Max . . 22.1-24.2 kTons . . 20 kTons 20 kTons 22.1 kTons 23 kTons 20.5 kTons
Summary and Outlook • Results of seismic interpretation and petrophysical data allowed a satisfactory CO2 mass estimation (91%-94% mass of injected CO2 to the time of the repeat survey) using values of • CO2 saturation derived by • a) Pulsed Neutron-Gamma Logging; • Multiphase-Flow Modeling; • and average CO2 density calculated with • measured temperature and pressure in reservoir at the injected site (in the injected well) to the time of the repeat survey; • Multiphase Flow Modeling for every well of the Ketzin site. • 2. Consequences for seismic data of CO2 effect on seismic velocities in reservoir rock (petrophysics) will be illustrated on synthetic seismic models. • 3. ‘Predicted’ distributions will be used to generate synthetic seismic data that will be compared directly to seismic field data.
Volumetricestimationbased on velocity push-down Structural model V0Caprock V1Aquifer V2 V0Auitard
3D Acquisition Parameters Parameter Value Receiver line spacing / number 96 m / 5 Receiver station spacing / channels 24 m /48 Source line spacing / number 48 m / 12 Source point spacing 24 m or 72 m CDP bin size 12 m x 12 m Nominal fold 25 Geophones 28 Hz single Sampling rate 1 ms Record length 3 s Source 240 kg accelerated weight drop, 8 hits per source point
Seismic Interpretation MIGRATION STACK STACK MIGRATION
Volumetricestimationbased on velocity push-down Structural model V0Caprock V1Aquifer V0Aquitard Top aquifer Bottomaquifer Bottomaquitard
Volumetricestimationbased on velocity push-down Structural model V0Caprock V1Aquifer V2 V0Aquitard Reflectors in time migratedimage Top aquifer Bottomaquifer Bottomaquitard ΔT
CO2 Storage at Ketzin Start of injection: 30th June, 2008 Food grade CO2 (99.9%) ~ 47,000 tons Saline aquifer (Stuttgart Formation) ~ 620 m – 650 m Juni 2008