Download
1 / 16
160 likes | 197 Views
Hypothesis testing and parameter estimation. Bhuvan Urgaonkar “Empirical methods in AI” by P. Cohen. System behavior in unknown situations. Self-tuning systems ought to behave properly in situations not previously encountered

E N D
Hypothesis testing and parameter estimation Bhuvan Urgaonkar “Empirical methods in AI” by P. Cohen
System behavior in unknown situations • Self-tuning systems ought to behave properly in situations not previously encountered • How to quantify the goodness of a system in dealing with unknown situations? • Statistical inference is one way
Statistical inference • Process of drawing inference about an unseen population given a relatively small sample • Populations and samples • Statistics: Functions on samples • Parameters: Functions on populations
Examples • Example 1: Toss a fair coin • Parameter: number of heads in 10 tosses • Can be determined analytically • Example 2: Two chess programs A and B play 15 games, A wins 10, draws 2, loses 3. • Parameter: probability that A wins • Population of all possible chess games too large to enumerate => we cannot know the exact value • Can estimate pwin as p=0.67 • p is a statistic derived from the above sample
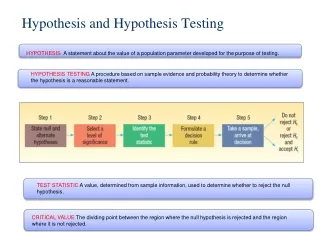
Two kinds of statistical inference • Hypothesis testing: Answer a yes-or-no question about a population and assess the probability that the answer is wrong • Assume pwin=0.5 and assess the probability of the sample result p=0.67 • If this is very small, A and B are not equal • Parameter estimation: Estimate the true value of a parameter given a statistic • If p=0.67, what is the “best” estimate of pwin • How wide an interval to draw around p to be confident that pwin falls within it?
Two kinds of statistical inference • Hypothesis testing: Answer a yes-or-no question about a population and assess the probability that the answer is wrong • Assume pwin=0.5 and assess the probability of the sample result p=0.67 • If this is very small, A and B are not equal • Parameter estimation: Estimate the true value of a parameter given a statistic • If p=0.67, what is the “best” estimate of pwin • How wide an interval to draw around p to be confident that pwin falls within it?
Hypothesis testing example • Two programs A and B that summarize news stories • Performance measured as recall, the proportion of the important parts of a story that make it into the summary • Suppose you run A every day for 120 days and record mean recall scores of 10 stories • Then you run B and want to answer: • Is B better than A?
Hypothesis testing steps • Formulate a null hypothesis • mean(A) = mean(B) • Gather a sample of 10 news stories and run them through B. Call the sample mean Emean(B) • Assuming the null hypothesis is right, estimate the distribution of mean recall scores for all possible samples of size 10 run through B • Calculate the probability of obtaining Emean(B) given this distribution • If this probability is low, reject the null hypothesis
Hypothesis testing steps • Formulate a null hypothesis • mean(A) = mean(B) • Gather a sample of 10 news stories and run them through B. Call the sample mean Emean(B) • Assuming the null hypothesis is right, estimate the distribution of mean recall scores for all possible samples of size 10 run through B • Calculate the probability of obtaining Emean(B) given this distribution • If this probability is low, reject the null hypothesis
Sampling distributions • Distribution of a statistic calculated from all possible samples of a given size, drawn from a given population • Example: Two tosses of a fair coin; sample statistic be the number of heads • Sampling distribution is discrete • Elements are 0, 1, 2 with probabilities 0.25, 0.5, 0.25 • How to get sampling distributions?
Exact sampling distributions • Coin tossed 20 times, num. heads=16 • Is the coin fair? • Sampling distribution of the proportion ph under the null hypo that the coin is fair • Easy to calculate exact probabilities of all the values for ph for N coin tosses • Possible values: 0/N, 1/N, …, N/N • Pr(ph=i/N) = N! * 0.5N / i! * (N-i)! • Pr(ph=16/20) = 0.0046 --- next to impossible!
Estimated sampling distributions • Unlike the sampling distribution of the proportion, that of the mean cannot be calculated exactly. • Recall the news story example • It can, however, be estimated due to a remarkable theorem
Central limit theorem • The sampling distribution of the mean of samples of size N approaches a normal distribution as N increases. • If samples are drawn from a population with mean M and std. dev SD, then the mean of the sampling distribution is M, its std. dev is SD/sqrt(N) • This holds irrespective of the shape of the population distribution!
The missing piece in hypothesis testing • Null hypothesis • mean(A) = mean(B) • We don’t know the distribution of mean(B), but we do know the distribution of Emean(A)! • CLT: Emean(A) = mean (A) = mean (B)
Computer-aided methods for estimating sampling distributions • Use simulation to estimate the sampling distribution • Monte Carlo tests • If population distribution is known but not the sampling distribution of the test statistic • Derive samples from this known distribution • Bootstrap methods • Population distribution is unknown • Idea: Resample from the sample (treat the sample as the population!)
Other related concepts/techniques • Hypotheses tests that work under different conditions • Z-test, t-test (small values of N) • Ref: Paul Cohen • Parameter estimation • Confidence intervals • Analysis of variance: interaction among variables • Contingency tables • Ref: Paul Cohen • Expectation maximization • X: observed data, Z: unobserved, Let Y=X U Z • Searches for h that maximizes E[ln P(Y | h)] • Ref: “Machine Learning” by Tom Mitchell