Download

1 / 32
340 likes | 577 Views
Sampling and monitoring the environment-2. Marian Scott Sept 2007. Outline. Spatial sampling Grid, transect and cluster sampling some case studies. Know what you are setting out to do before you start. · describing a characteristic of interest (usually the average),

E N D
Sampling and monitoring the environment-2 Marian Scott Sept 2007
Outline • Spatial sampling • Grid, transect and cluster sampling • some case studies
Know what you are setting out to do before you start ·describing a characteristic of interest (usually the average), ·describing the magnitude in variability of a characteristic, ·describing spatial patterns of a characteristic,mapping the spatial distribution, ·quantifying contamination above a background or specified intervention level ·detecting temporal or spatial trends, ·assessing human health or environmental impacts of specific facilities, or of events such as accidental releases, • assessing compliance with regulations
5 step approach • Define the objectives and questions to be answered • Summarize the environmental context for the quantities being measured. • Identify the population, including spatial and temporal extent. • Select an appropriate sampling design. • Document the sampling design and its rationale.
Spatial sampling • In ecology, spatial data usually fall into one of two different general cases: • Case 1: We assume that there is an attribute that is spatially continuous, where in principle it is possible to measure the attribute at any location defined by coordinates (x, y) over the domain or area of interest. • Case 2: The attribute is not continuous through space; it exists and can be measured only at specific locations (see point processes in spatial session).
What is the population? • The concept of the population is important. The population is the set of all items that could be sampled, such as, all trees in a spatially defined forest, or all 20-g soil samples from a field. Appropriate specification of the population includes a description of its spatial extent and perhaps its temporal stability
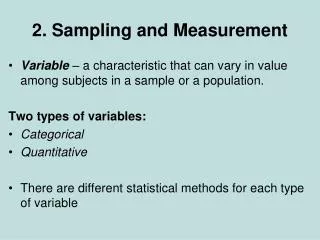
Sampling units • In some cases, sampling units are discrete entities (i.e., animals, trees), but in others, the sampling unit might be investigator-defined, and arbitrarily sized. • Statistical sampling leads to a description of the sampled members of the population and inference(s) and conclusion(s) about the population as a whole.
Random and stratified random sampling In random sampling, a random sample of locations at which the attribute is to be measured is chosen from the target population of locations. If there is knowledge of different strata over the sampling domain (such as soil type), the use of a stratified sample would be recommended and a random sample of locations would be selected within each strata. The data set is then given by the spatial coordinates of each measurement location and the measured value of the attribute at that location
Population of N units-10 randomly selected Random digits: 5,17,23, 25, 31, 33,42, 45,46,51
systematic sampling Usually, for systematic sampling the region is considered as being overlaid by a grid (rectangular or otherwise), and sampling locations are at gridline intersections at fixed distance apart in each of the two directions. The starting location is expected to be randomly selected. Both the extent of the grid and the spacing between locations are important. The sampling grid should span the area of interest (the population). If the goal of the study is to describe spatial correlations, the spacing between locations should be shorter than the range of the correlation.
Population of N (9x6) units-9 systematically selected Systematic selection: 6,12,18,24,30,36,42,48
Quadrats and transects • A quadrat is a well-defined area within which one or more samples are taken; it is usually square or rectangular in shape, with fixed dimensions. The position and orientation of the quadrat will be chosen as part of the sampling scheme. • A line transect is a straight line along which samples are taken, the starting point and orientation of which will be chosen as part of the sampling scheme. In addition, the number of samples to be collected along the transect, and their spacing requires definition.
Site a Site b Site c Within same year
Cluster sampling • Cluster sampling is particularly useful in patchy environments. The population is divided into primary units; each primary unit is divided into secondary units. In the spatial context, all the sub-units are physically close together. A sampling design (e.g., a simple random sample or a systematic design) is used to select a subset of the primary units. Then, all the sub-units in the chosen primary units are sampled.
Cluster sampling • As an example, consider sampling lichens growing on boulders scattered in a forest. It would be difficult and perhaps impossible to enumerate all the lichens, from which to draw a simple random sample. A systematic sample would be a problem because there may not be any lichen at many of the grid points. A cluster sample then becomes a reasonable sampling method. The boulders are the primary units. The secondary units are the lichens.
An example- ECCOMAGS Project • Funded by EC FPV – Nuclear Safety, • Partners • BfS (Germany), CEA (France), DEMA/DTU (Denmark), GBA (Austria), HSK (Switzerland), IGM (Portugal), SSI (Sweden), SGU (Sweden), STUK (Finland), SURRC (UK) • Airborne Gamma-ray Spectrometry (AGS) • To assess comparability of the European AGS systems • To assess comparability of AGS with ground-based systems.
Pre-Characterisation-sampling plan for in-situ measurement • Expanding hexagonal sampling pattern showing the radial numbers and shell designations.
Summary • Statistical sampling is pertinent and necessary in ecology because of the natural stochastic variation that occurs in all environmental media, and the fact that this variation is usually much larger than variations associated with measurement uncertainties.
Monitoring sites used for classification 2007 2006 Achievements
Time and time and space • Category A: Temporal sampling with sampling units selected independently from the population at each time point. • Category B: Temporal sampling with repeated measurements on the same sampling units. • Category C: Environmental impact assessment. • Category D: Spatio-temporal sampling
Before-after-control-impact (BACI) designs • One of the most plausible alternative explanations of a change is that the system changed ‘on its own’. That is, the observed change (from the before-event samples to the after-event samples) would have happened even in the absence of the known impact. • One simple impact-assessment design evaluates this alternative by estimating the change at a control site presumed to be unaffected by the known event. Data are collected at four combinations of sites and times: affected and unaffected sites, each sampled before the impact and after the impact.
Before-after-control-impact (BACI) designs • The impact of the known event is estimated by the interaction between sites and times, i.e., the difference between the change at the impacted site and the change at the control site. The BACI design controls for additive temporal change unrelated to the known event. • Elaborations on the basic BACI design include using multiple control sites to estimate spatial variability and spatial trends, multiple samples from the impacted area to estimate variability within the impacted area, and very frequent sampling to better characterize the nature of the impact.
summary • Sampling and monitoring the environment is carried out for many purposes, including estimation of certain characteristics. • Many experimental and monitoring programs have multiple objectives that must be clearly specified before the sampling program is designed, because different purposes require different sampling strategies and sampling intensities in order to be efficient, and to permit general inferences.
summary • Statistical sampling is pertinent and necessary in ecology because of the natural stochastic variation that occurs in all environmental media, and the fact that this variation is usually much larger than variations associated with measurement uncertainties.
case studies • Rosyth (stratified sampling within an estuary) and • Mururoa (sampling within an atoll)