Download
1 / 38
380 likes | 392 Views
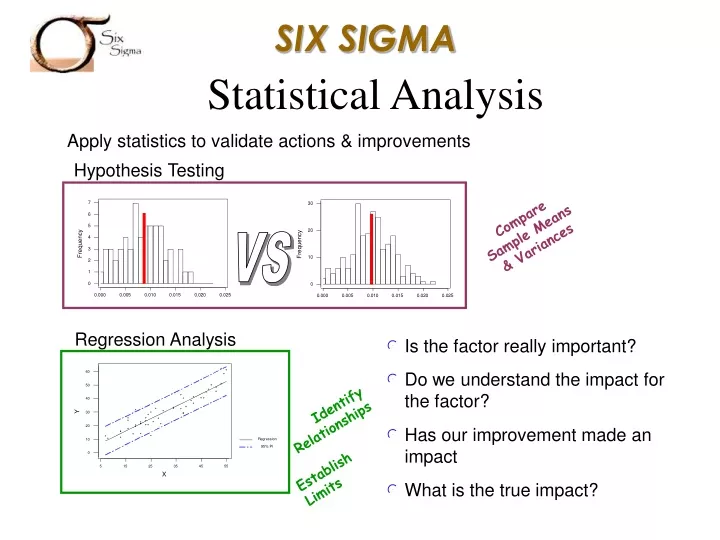
Statistical Analysis. Apply statistics to validate actions & improvements. Hypothesis Testing. Compare Sample Means & Variances. VS. Regression Analysis. Is the factor really important? Do we understand the impact for the factor? Has our improvement made an impact

E N D
Statistical Analysis Apply statistics to validate actions & improvements Hypothesis Testing Compare Sample Means & Variances VS Regression Analysis • Is the factor really important? • Do we understand the impact for the factor? • Has our improvement made an impact • What is the true impact? Identify Relationships Establish Limits
poor A B 2.5 2.0 1.5 1.0 0.5 CONTROL D C Z shift 1 2 3 4 5 6 good poor good TECHNOLOGY • St A- Poor Control, Poor Process B- Must control the Process better, Technology is fine C- Process control is good, bad Process or technology D- World Class
M.A.D Six Sigma Design Process Stop Adjust process & design Technical Requirement Con-sumer Cue Identify Critical Process Preliminary Drawing/Database Obtain Data on Similar Process Calculate Z values Rev 0 Drawings Identity CTQs Stop Fix process & design 1st piece inspection Z<3 Prepilot Data Recheck ‘Z’ levels Obtain data Z>= Design Intent M.A.I.C Pilot data
QFD, FMEA, RTY • #1 Define the customer Cue and technical requirement we need to satisfy Consumer Cue: Blocks Cannot rattle and must not interfere with box Technical Requirement: There must be a positive Gap
#2 Define the target dimensions (New designs) or process mean (existing design) for all mating Parts Gap Gap Must Be T=.011, LSL=.001 and USL = .021
(+) Gap Requirements mT = .010 USL = .020 LSL = .001 (-) (-) (-) (-) Step #3 • Gather process capability data. • Use actual or similar part data to calculate SS of largest contributors. • May use expert data for minimal contributors • Do not calculate s from current tolerances
From process: Average sst Cube 1.250 .001 Box 5.080 .001 (+) (-) (-) (-) (-) mgap= mbox – mcube1 – mcube2 – mcube3 – mcube4 sgap = s2box + s2cube1 + s2cube2 + s2cube3 + s2cube4 Short Term mgap= 5.080 – 1.250 – 1.250 – 1.250 – 1.250 = .016 sgap = (.001)2+ (.001)2+ (.001)2+ (.001)2+ (.001)2= .00224 Long Term sgap = (.0015)2+ (.0015)2+ (.0015)2+ (.0015)2+ (.0015)2= .00335 Zshift = 1.6
Measure Characterize Process Evaluate Control Understand Process Maintain New Process Improve Improve and Verify Process
What Do I need to do to improve my Game? 6 GUTTER!
Design of Experiments (DOE) • To estimate the effects of independent Variables on Responses. • Terminology • Factor – An independent variable • Level – A value for the factor. • Response - Outcome X Y PROCESS
Main Effects: Effect of each individual factor on response 3.7 ME Taste 2.2 Bean ‘A’ Bean ‘B’
Concept of Interaction Interaction Taste Bean ‘A’ Temp ‘X’ Bean ‘B’ Temp ‘Y’
Why use DoE ? • Shift the average of a process. • Reduce the variation. • Shift average and reduce variation x1 x2
DoE techniques • Full Factorial. • 24 = 16 trials • 2 is number of levels • 4 is number of factors • All combinations are tested. • Fractional factorial can reduce number of trials from 16 to 8.
DoE techniques….contd. • Fractional Factorial • Taguchi techniques • Response Surface Methodologies • Half fraction
Design Array No Gluing Str ` A B C D 1 + + + - 9.8 2 + + - - 8.9 A - Adhesion Area (cm2) B - Type of Glue C - Thickness of Foam Styrene D - Thickness of Logo 3 + - + + 9.2 4 + - - + 8.9 5 - + + - 12.3 6 - + - - 13 7 - - + + 13.9 8 - - - + 12.6 Effect Tabulation
Factor Effect Plot 6.5 5.58 5.65 5.58 Gluing Strength 5.5 5 5.43 4.6 + + + + - - - - Adhesion Area Thk of Foam Styrene Thk of logo Type of Glue
STEPS IN PLANNING AN EXPERIMENT • Define Objective. • Select the Response (Y) • Select the factors (Xs) • Choose the factor levels • Select the Experimental Design • Run Experiment and Collect the Data • Analyze the data • Conclusions • Perform a confirmation run.
“….No amount of experimentation can prove me right; a single experiment can prove me wrong”. “….Science can only ascertain what is, but not what should be, and outside of its domain value judgments of all kinds remain necessary.” - Albert Einstein
Measure Characterize Process Evaluate Control Understand Process Maintain New Process Improve Improve and Verify Process
CONTROL PHASE - SIX SIGMA Control Phase Activities: • Confirmation of Improvement • Confirmation you solved the practical problem • Benefit validation • Buy into the Control plan • Quality plan implementation • Procedural changes • System changes • Statistical process control implementation • “Mistake-proofing” the process • Closure documentation • Audit process -Scoping next project
CONTROL PHASE - SIX SIGMA How to create a Control Plan: 1. Select Causal Variable(s). Proven vital few X(s) 2. Define Control Plan - 5Ws for optimal ranges of X(s) 3. Validate Control Plan - Observe Y 4. Implement/Document Control Plan 5. Audit Control Plan 6. Monitor Performance Metrics
CONTROL PHASE - SIX SIGMA Control Plan Tools: 1. Basic Six Sigma control methods. - 7M Tools: Affinity diagram, tree diagram, process decision program charts, matrix diagrams, interrelationship diagrams, prioritization matrices, activity network diagram. 2. Statistical Process Control (SPC) - Used with various types of distributions - Control Charts • Attribute based (np, p, c, u). Variable based (X-R, X) • Additional Variable based tools -PRE-Control -Common Cause Chart (Exponentially Balanced Moving Average (EWMA))
OVERALL GOAL OF SOFTWARE PRODUCT MANAGEMENT SUPERVISION PRODUCT DESIGN PRODUCT MANAGEMENT PRODUCT DESIGN PRODUCT MANAGEMENT OUTPUT INTUITIVE ANSWERS SUPPORT KNOWLEDGE OF COMPETITORS DIRECTORY ORGANIZATION AFFINITY DIAGRAM INNOVATION CHARACTERISTICS: • Organizing ideas into meaningful categories • Data Reduction. Large numbers of qual. Inputs into major dimensions or categories. METHODS TO MAKE EASIER FOR USERS
HOWS RELATIONSHIP MATRIX CUSTOMER IMPORTANCE MATRIX WHATS MATRIX DIAGRAM
(9) = Strong Influence (3) = Some Influence (1) = Weak/possible influence Means row leads to column item Means column leads to row item COMBINATION ID/MATRIX DIAGRAM CHARACTERISTICS: • Uncover patterns in cause and effect relationships. • Most detailed level in tree diagram. Impact on one another evaluated.
CONTROL PHASE - SIX SIGMA Control Plan Tools: 1. Basic Six Sigma control methods. - 7M Tools: Affinity diagram, tree diagram, process decision program charts, matrix diagrams, interrelationship diagrams, prioritization matrices, activity network diagram. 2. Statistical Process Control (SPC) - Used with various types of distributions - Control Charts • Attribute based (np, p, c, u). Variable based (X-R, X) • Additional Variable based tools -PRE-Control -Common Cause Chart (Exponentially Balanced Moving Average (EWMA))
Attributes Type Data Variables Measurement of subgroups Individuals Defects Defectives Ind. Meas. or subgroups Normally dist. data Graph defects of defectives Yes Yes Yes Interest in sudden mean changes X - R X, Rm C, u Oport. Area constant from sample to sample No No No p, np Use X - R chart with modified rules If mean is big, X and R are effective too Yes u p Size of the subgroup constant MA, EWMA or CUSUM and Rm No Ir neither n nor p are small: X - R, X - Rm are effective More efective to detect gradual changes in long term How do we select the correct Control Chart:
RED ZONE YELLOW ZONE GREEN ZONE YELLOW ZONE RED ZONE Reference Line PRE-Control Reference Line PRE-Control Tolerance Limt Tolerance Limt NOMINAL DIMENSION Low High 1/4 TOL. 1/2 TOL. 1/4 TOL. Additional Variable based tools: 1. PRE-Control • Algorithm for control based on tolerances • Assumes production process with measurable/adjustable quality characteristic that varies. • Not equivalent to SPC. Process known to be capable of meeting tolerance and assures that it does so. • SPC used always before PRE-Control is applied. • Process qualified by taking consecutive samples of individual measurements, until 5 in a row fall in central zone, before 2 fall in cautionary. Action taken if 2 samples are in Cau. zone. • Color coded
2. Common Causes Chart (EWMA). • Mean of automated manufacturing processes drifts because of inherent process factor. SPC consideres process static. • Drift produced by common causes. • Implement a “Common Cause Chart”. • No control limits. Action limits are placed on chart. • Computed based on costs • Violating action limit does not result in search for special cause. Action taken to bring process closer to target value. • Process mean tracked by EWMA • Benefits: • Used when process has inherent drift • Provide forecast of where next process measurement will be. • Used to develop procedures for dynamic process control • Equation: EWMA = y^t + s (yt - y^t) s between 0 and 1
Project Closure • Improvement fully implemented and process re-baselined. • Quality Plan and control procedures institutionalized. • Owners of the process: Fully trained and running the process. • Any required documentation done. • History binder completed. Closure cover sheet signed. • Score card developed on characteristics improved and reporting method defined.
Motorola ROI 1987-1994 • Reduced in-process defect levels by a factor of 200. • Reduced manufacturing costs by $1.4 billion. • Increased employee production on a dollar basis by 126%. • Increased stockholders share value fourfold. AlliedSignal ROI 1992-1996 • $1.4 Billion cost reduction. • 14% growth per quarter. • 520% price/share growth. • Reduced new product introduction time by 16%. • 24% bill/cycle reduction.
General Electric ROI 1995-1998 • Company wide savings of over $1 Billion. • Estimated annual savings to be $6.6 Billion by the year 2000.
Bibliography • Control Engineering On line, “Design for Six Sigma Capability” http://www.controleng.com/, 1999 • Forrest W. Breyfogle III, “Implementing Six Sigma”, John Wiely & Sons, Inc,1999 • Infinity Performance Systems, “Six Sigma Overview”, http://www.6sigmaworld.com/six_sigma.htm, 2000 • Motorola Inc., “What is 3 vs. 6 sigma”, http://www.Motorola.com/MIMS/MSPG/Special/CLM/sld011.htm, 1997 • Sigma Holdings, Inc., “Six Sigma Breakthrough Strategy”, http://www.6-sigma.com/Bts1.htm, 2000 • Six Sigma SPC / Jim Winings, “Six Sigma & SPC”, http://www.sixsigmaspc.com/six_sigma.html, 2001 • StatPoint, LLC. “Six Sigma Tour”, http://www.sgcorp.com/six-sigma_tour.htm, 2001