Download
1 / 8
80 likes | 179 Views
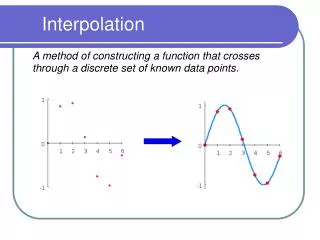
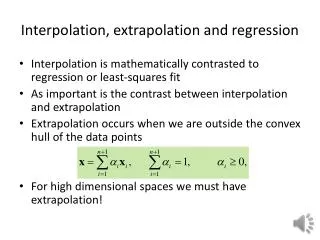
Dijet Resonances “Interpolation Study”. Kazim Gumus 27 September 2005. Goal. We want to interpolate resonance shapes every 100GeV from 0.7 to 5TeV. To do that we will use the MC data which are 0.7, 2 and 5 TeV Z’ data. Method:

E N D
Dijet Resonances“Interpolation Study” Kazim Gumus 27 September 2005 TTU HEP meeting
Goal • We want to interpolate resonance shapes every 100GeV from 0.7 to 5TeV. • To do that we will use the MC data which are 0.7, 2 and 5 TeV Z’ data. Method: • Take each of the resonances at 0.7, 2 and 5 TeV and make histograms out of them normalized to 1. • Convert 10% increasing binned histograms to fixed binned ones. • Interpolate resonances, using the combination of quadratic and linear interpolation methods • Normalize them again. • Convert the interpolated histograms back to 10% increasing binned form TTU HEP meeting
Simulated Z’ Data (Mass=700GeV) 10% increasing bins [0, 10, 21, 33.1, 46.41 … ] TTU HEP meeting
old bin1 xsec1 old bin2 xsec2 new bin xsec %10 increasing bins Fixed bins binwidth p (bw-p) Converting 10% Increasing Binned Hist. to Fixed Binned Ones A resonance of mass m is converted in a way that dijet mass ranges from 0.3*mass to 1.3*mass. Bin width is 1/40 of resonance mass. (Example:1000GeV resonance will have 25GeV fixed bin widths) TTU HEP meeting
Comparison of Fixed and Increasing Binned Histograms Black Increasing binned histogram Red fixed binned histogram TTU HEP meeting
Interpolation technique • Two dimensional quadratic interpolation inside the resonance masses which are one above and one below the resonance mass we wanted, to find the differential cross section at any dijet mass for a simulated resonance mass. • Then linear interpolation between the two resonance masses, one above and one below the resonance mass I wanted, to find the fractional cross section for the particular resonance mass. Example: • Interpolate 1000GeV Resonance histogram. • Use one above and one below data which are 700GeV and 2TeV histograms • For each bin of the histogram to be interpolated; • Do quadratic interpolation inside 700GeV, using corresponding bins. Get cross section 1 • Do quadratic interpolation inside 2TeV, using corresponding bins. Get cross section 2 • Do linear interpolation, using cross section 1 and 2. Get final results. TTU HEP meeting
Interpolated Histograms TTU HEP meeting
Questions • Why are the shape of interpolated histograms same? • Why are the mean values of histograms off some value, and this difference increases as the Resonance mass increases? • Any other interpolation suggestions? Future Plans Need to figure out the questions Plan to convert fixed binned interpolated histograms back to 10% increasing binned ones. TTU HEP meeting