Download
1 / 13
130 likes | 165 Views
Learn how the total Sum of Squares (SS) in regression can be decomposed into error SS and regression SS, and understand the coefficient of determination, ANOVA table, prediction intervals, and more in this comprehensive guide. Dive into dummy variable regression too!

E N D
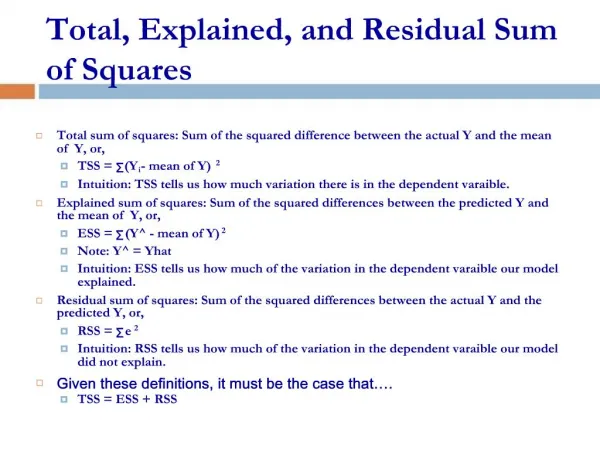
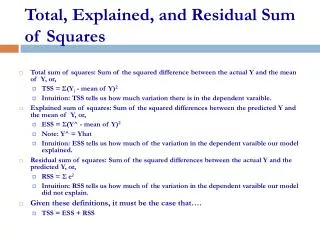
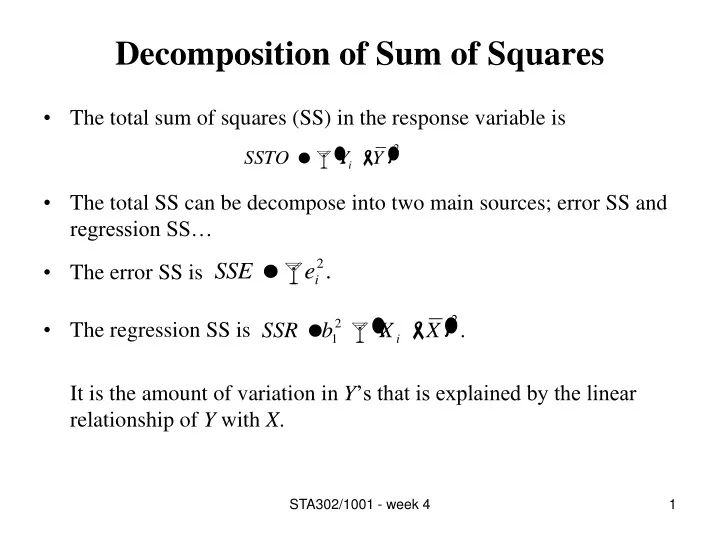
Decomposition of Sum of Squares • The total sum of squares (SS) in the response variable is • The total SS can be decompose into two main sources; error SS and regression SS… • The error SS is • The regression SS is It is the amount of variation in Y’s that is explained by the linear relationship of Y with X. STA302/1001 - week 4
Claims • First, SSTO = SSR +SSE, that is • Proof:…. • Alternative decomposition is • Proof: Exercises. STA302/1001 - week 4
Analysis of Variance Table • The decomposition of SS discussed above is usually summarized in analysis of variance table (ANOVA) as follow: • Note that the MSE is s2 our estimate of σ2. STA302/1001 - week 4
Coefficient of Determination • The coefficient of determination is • It must satisfy 0 ≤R2≤ 1. • R2 gives the percentage of variation in Y’s that is explained by the regression line. STA302/1001 - week 4
Claim • R2 = r2, that is the coefficient of determination is the correlation coefficient square. • Proof:… STA302/1001 - week 4
Important Comments about R2 • It is a useful measure but… • There is no absolute rule about how big it should be. • It is not resistant to outliers. • It is not meaningful for models with no intercepts. • It is not useful for comparing models unless same Y and one set of predictors is a subset of the other. STA302/1001 - week 4
ANOVE F Test • The ANOVA table gives us another test of H0: β1 = 0. • The test statistics is • Derivations … STA302/1001 - week 4
Prediction of Mean Response • Very often, we would want to use the estimated regression line to make prediction about the mean of the response for a particular X value (assumed to be fixed). • We know that the least square line is an estimate of • Now, we can pick a point, X = x* (in the range in the regression line) then, is an estimate of • Claim: • Proof: • This is the variance of the estimate of E(Y | X=x*). STA302/1001 - week 4
Confidence Interval for E(Y | X = x*) • For a given x, x* , a 100(1-α)% CI for the mean value of Y is where STA302/1001 - week 4
Example • Consider the smoking and cancer data. • Suppose we wish to predict the mean mortality index when the smoking index is 101, that is, when x* = 101…. STA302/1001 - week 4
Prediction of New Observation • Suppose we want to predict a particular value of Y* when X = x*. • The predicted value of a new point measured when X = x* is • Note, the above predicted value is the same as the estimate of E(Y | X = x*). • The predicted value has two sources of variability. One is due to the regression line being estimated by b0+b1X. The second one is due to ε* i.e.,points don’t fall exactly on line. • To calculated the variance in error of prediction we look at the difference STA302/1001 - week 4
Prediction Interval for New Observation • 100(1-α)% prediction interval for when X = x* is • This is not a confidence interval; CI’s are for parameters and we are estimating a value of a random variable. • Prediction interval is wider than CI for E(Y | X = x*). STA302/1001 - week 4
Dummy Variable Regression • Dummy or indicator variable takes two values: 0 or 1. • It indicates which category an observation is in. • Example… • Interpretation of regression coefficient in a dummy variable regression… STA302/1001 - week 4