Download
1 / 11
130 likes | 294 Views
Lesson 4. Inference and box plots. Focus . Inferring back to the population Box plots. Karekare College. PROBLEM. Do boys at Karekare College tend to have longer popliteal lengths than girls at Karekare college?. DATA. Sample of 30ish boys and 30ish girls from Karakare College.

E N D
Lesson 4 Inference and box plots
Focus • Inferring back to the population • Box plots
PROBLEM • Do boys at Karekare College tend to have longer popliteal lengths than girls at Karekare college?
DATA • Sample of 30ish boys and 30ish girls from Karakare College
ANALYSIS • I notice… • Write three I notice statements about this graph…
ANALYSIS • I notice… (describe what is happening in your samples) • I wonder… (inferential statement about what might be happening back in your population)
Box plot reminder MEDIAN – halfway through ordered data • Mark the middle of all the values… • How do we find this? • Odd/even sample sizes? • What is the name of this STATISTIC?
QUARTILES–quarter of the way through ordered data Box plot reminder • Mark the middle of the bottom half and the middle of the top half… • How do we find this? • Median included or not? • What is the name of these STATISTICS?
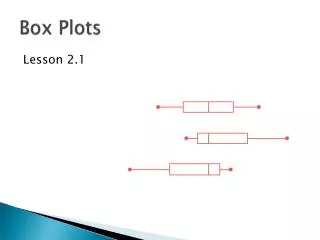
Box plot reminder • Join these three values up with a box • The middle value is a line through the box • Extend a line from the box to the smallest and largest values • Congratulations – you’ve made a box plot!
Box plot reminder • Box plots split the data up into quarters • We often refer to the middle 50% which is the box part.