Download
1 / 23
230 likes | 396 Views
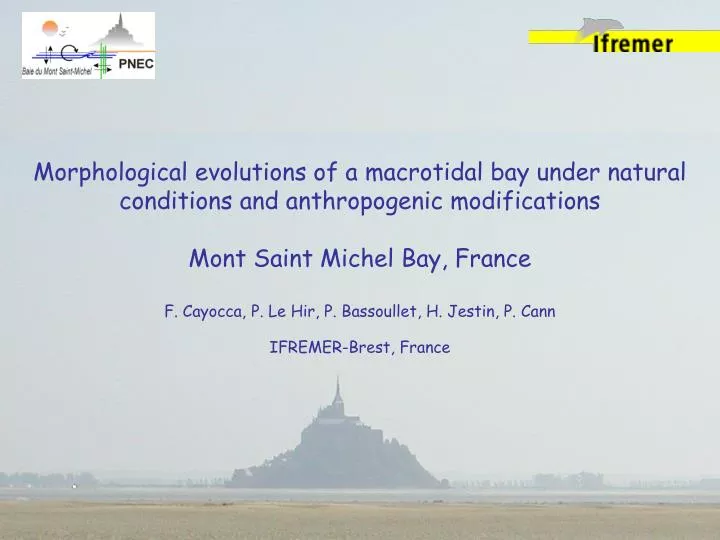
Morphological evolutions of a macrotidal bay under natural conditions and anthropogenic modifications Mont Saint Michel Bay, France F. Cayocca, P. Le Hir, P. Bassoullet, H. Jestin, P. Cann IFREMER-Brest, France. 20 km. Oyster beds. Oyster beds. Mussel farms. Mussel farms.

E N D
Morphological evolutions of a macrotidal bay under natural conditions and anthropogenic modifications Mont Saint Michel Bay, France F. Cayocca, P. Le Hir, P. Bassoullet, H. Jestin, P. Cann IFREMER-Brest, France
20 km Oyster beds Oyster beds Mussel farms Mussel farms Mont St-Michel English Channel Max tidal range : 14 m Max tidal range : 14 m
English Channel Oyster beds
Mussel farms Photo : F. Cayocca
Sediment distribution sand muddy sands mud (after Ehrhold, 1999)
ADCP measurements on tidal flat Main tidal flow on the intertidal flat: Cross-shore & flood dominant Current vertical profile
wind (intensity, direction) Wave index (m) sediment level (cm)ALTUS • In the western part • tidal influence • same relationship between wind / waves / turbidity • strong wave erosion • - fast recovery S.P.M. (g/l) 20 cm above bottomOBS Water level (m) time (days, since 2003/02/01)
Development of a 2DH numerical model in order to : • simulate the spatial and temporal variation of turbidity (related to the primary production) • constitute a physical basis for ecological modelling (trophic capacity) • investigate the effects of mussel farms on sediment patterns
- SiAM2D model (hydrodynamics & sedimentary processes) • - cartesian irregular grid • - tide & wind forcings • - waves: under process (wave/current coupling) • - sediment transport : suspension only • « on-line » consolidation • Mussel farms: Strickler friction adjustment • (function of posts size, spacing between rows, angle between current and rows (previous study: LCHF, 1987) dy = 200 m to 500 m dx = 200 m to 400 m
Model Validation Along shore flow Cross-shore flow
Sediment coverage Computed maximum current velocities 2.5 m.s-1 0 m.s-1
flood high tide ebb low tide Influence of the mussel farms on the current magnitude
Sediment deposits after 1 year (tide only) Initial uniform sediment thickness : 0.1 m Without mussels farm Maximum velocities Deposits thickness
Initial uniform sediment thickness : 0.1 m Sediment deposits after 1 year (tide only) with mussel farms without farms
with without Evolution of muddy sediment thickness over one month with and without farms Water level
with without Evolution of S.P.M. concentrations over one month with and without farms Water level
Waves : SWAN computations (bottom velocity) Propagation Refraction (bathymetry & currents) high tide low tide flood ebb
Sediment deposits after 1 year (tide + constant small waves) Initial uniform sediment thickness : 0.1 m With mussels farm Tide only Tide + waves
1 march 2003 26 feb 2003 Evolution of deposits after a 24 hour long storm Storm 27/28 feb 28 feb 2003 28 feb 2003
5 march 2003 14 march 2003 25 march 2003 Evolution of deposits after a 24 hour long storm
Conclusions & discussion • tidal flow intensity controls the sediment coverage, but not the dynamics • although macrotidal environment, sediment erosion/deposition is strongly controlled by waves, wind-induced currents • reduction of flow intensity within the mussel farms, acceleration on sides • increased deposition around the farm and onshore • increased sediment dynamics in the area, and consequently increased turbidity • validation of mussel farms impact is required (ADCP campaign) • modelling under process : stabilization of sediment budget after 1y • mixtures of mud and fine sand • inclusion of biodeposits ?