Download
1 / 42
480 likes | 745 Views
Modeling the Influence of Cattle Management on Dry Matter Intake. Rick Grant*, Tom Tylutki † , and Peter Krawczel* *William H. Miner Agricultural Research Institute, Chazy, NY and † AMTS LLC, Cortland, NY. Presented at 2010 ADSA/ASAS Conference, Denver, CO. William H. Miner Agricultural

E N D
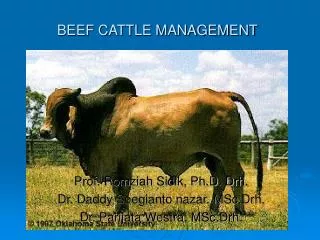
Modeling the Influence of Cattle Management on Dry Matter Intake Rick Grant*, Tom Tylutki†, and Peter Krawczel* *William H. Miner Agricultural Research Institute, Chazy, NY and †AMTS LLC, Cortland, NY Presented at 2010 ADSA/ASAS Conference, Denver, CO
William H. Miner Agricultural Research Institute
Predicting dry matter intake in cattle • Accurate prediction of DMI is key component of nutrition models • Body weight, milk yield, stage of lactation • DMI predictions can be improved by including measures of physical and social environment
Physical Environment Social Environment Feeding Environment Modulation • Resting • Feeding • Meals • Meal length • Eating rate Gut Fill Chemostatic Mechanisms Control Dry Matter Intake
Physical environment inputs:Example CNCPS (Fox et al., 2004) • Temperature, relative humidity • Current and previous • Wind speed • Hours in sunlight • Mud depth in lot • Activity level • Time standing • Distance walked • Potential to improve these inputs
Focus: Social Environment • When cattle are grouped, social behavior modifies DMI & productivity (Grant and Albright, 2001) • Future modeling efforts should focus on: • Social factors of greatest importance to feeding behavior • stocking density • grouping strategy • interaction with physical environment
Stocking density and cattle behavioral response • As stocking density increases: • Greater frequency of aggressive interactions • More displacements; altered time of feeding • Faster eating rate • Reduced latency to lie down • Less lying time • More standing in alley • Decreased rumination activity • Question: What is effect on meal patterns, DMI, and other responses?
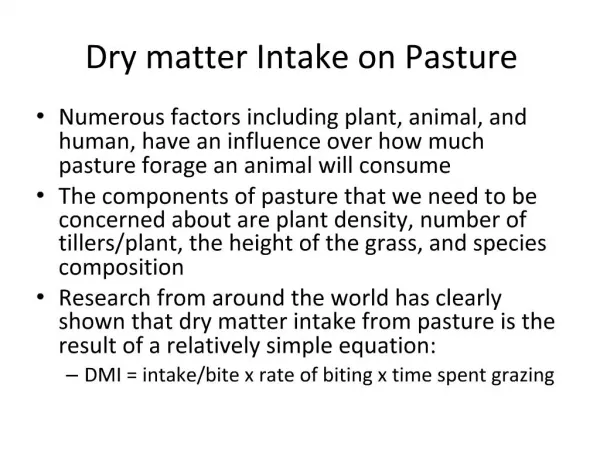
Stocking rate data base:lactating dairy cattle • 14 studies that measured feeding behavior as well as DMI • TMR feeding and free-stall • Pen and individual feeding studies • Stocking density imposed on feed space only or feed and free-stalls • Feeding system varied by study • Feed bins • Headlocks • Post and rail
Greater feeding time ≠ Greater dry matter intake • Feeding time poorly correlated (r = 0.18) with total daily DMI(Kauffman et al., 2007) • Constitutes a major constraint on studies that only measure feeding behavior for quantitatively modeling DMI
Stocking density and DMI • Weak short-term relationship between stocking density or manger space and DMI
Stocking density and eating rate • Eating rate increases with increased stocking density, reduced feeding space
Stocking density and meals per day • More meals, especially below ~0.4 m/cow (16 in)
Stocking density and meal size • Smaller meal size, especially below ~0.40 m/cow
Stocking density, grouping strategy, & DMI • Group to increase homogeneity • Primi- vs multiparous cows • DMI reduced by 10% • Resting reduced by 20% • Milk reduced by 9% (Kongaard and Krohn, 1980) • Greater loss of BW by 30 DIM • Reduced FCM/DMI by 30 DIM (Bach et al., 2006) • Less drinking, rumination, and milk fat % (Bach et al., 2007) • Interaction with stocking density?
MP PP Stocking density and DMI by parity in mixed groups • Interaction between parity and stocking density • Component of future models
Feeding environment: defined by social and physical environment • Typical feeding environment in US based on recent surveys: • 3-row pens > 2-row pens • Once daily feeding > multiple deliveries • Post & rail > headlocks • ~18 in/cow bunk space • Feed push-up ~4 to 6x/d • Feed refusal rate ~3.5% > clean bunk • Mixed > group by parity
Stimulating feeding behavior: Priorities for modeling feeding strategy • Feed accessibility & periods of empty bunks • Feed push-up • More important during the day rather than at night (DeVries et al., 2005) • Feeding frequency, delivery of fresh feed • Biggest driver of feeding behavior is delivery of fresh feed(DeVries et al., 2003; 2005)
Feeding frequency of TMR *17% decrease in latency to lie down • Greater FF may improve rumen fermentation, rumination time, and eating time, but often it reduces lying time and DMI
Role of time budgeting in ration formulation? • Appears to be a requirement for resting/lying down • 12 to 13 h/d (Munksgaard et al., 2005) • 11.5, 13.5 h/d (low, high milk; Grant, 2004) • 11.4 to 13.7 h/d (Cook et al., 2005; Drissler et al., 2005) • 12.9 h/d (Fregonesi et al., 2007) • Inelastic demand of 12-13 h/d (heifers; Jensen et al., 2005) • Baseline requirement ~12 h/d
Resting influences feeding behavior (Munksgaard et al., 2005) • Lying time has priority over eating when measured at all stages of lactation • Cows will sacrifice eating time to compensate for lost resting time • Cows may compensate for reduction in feeding time by increasing rate of feed consumption (they began to “slug-feed”) • Not possible with lying behavior
Reduction in eating time with rest deprivation • Lying-deprived cows spend less time eating during period of lying deprivation & after deprivation (Cooper et al., 2007) • With situation of chronic rest deprivation, we speculate reduced eating time • Relationship between lost rest and eating time: • For every 3.5 minutes of lost rest, cows sacrifice 1 minute of eating
Where could we go in next decade? Modeling approach • Time budgeting • Cows have a minimum resting time requirement • Cows will adjust eating time to ensure resting time requirement met • DMI may or may not change depending on meal size and number of meals • Function of feed and feeding environment
Where do we go in next decade? Two modeling approaches • Theoretical dynamic model • Non-steady state • Based on relationships in data base • Simpler predictive model can be implemented in current formulation systems • On-farm inputs, spreadsheet
Derived equations from database for feeding & resting can be incorporated into models • Resting time, min/d • Number of meals, n/d • Meal size, kg of DM/meal • Eating time, min/d • Eating rate, g of DM/min • DMI, kg/d • Directly and as a calculation using number of meals and meal size predictions • Resting time adjustment (%) based on feeding frequency
Resting Time, min/d R-sq = 0.94, RMSE = 28.2 Number of meals, n/d R-sq = 0.82, RMSE = 0.6
Meal Size, kg DM/meal R-sq = 0.99, RMSE = 0.1 Eating time, min/d R-sq = 0.77, RMSE = 32.2
Eating rate, g DM/min R-sq = 0.83, RMSE = 11.6 Dry matter intake, kg/d R-sq = 0.91, RMSE = 1.3
Resting time adjustment for feeding frequency, % R-sq = 0.99 RMSE = 0.2
Looking to the future:Theoretical dynamic model • Existing components of CNCPSv6.1 used to determine initial values • Cow group descriptors • DMI, physical environment adjustments for DMI • Existing CNCPSv6.1 rumen sub-model • Interactions between VFA production, intake patterns, and cow health needed • Incorporation of social environment inputs needed
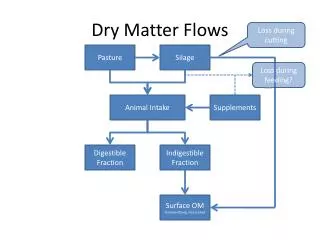
Generic Overview of Stocking Rate and DM Intake Relationships
Interactions betweenresting time and eating time: most difficult to model
Impact on degradation, nutrient flows, and cow health; non-steady state
Short-term: simpler predictive model • Based on previously derived equations and relationships • Inputs easily collected on-farm • Can be used to: • estimate DMI, eating behavior • illustrate impact of limited bunk space and variable feeding frequency on resting time and DMI • Excel spreadsheet implementation
Vision for nutrition models in next decade • Social and physical environment define the feeding environment that modulates DMI • Models must incorporate key inputs to predict feeding behavior and adjusted DMI • Time budget analysis (eating & resting) should become a routine part of DMI prediction and ration formulation