Download
1 / 18
180 likes | 352 Views
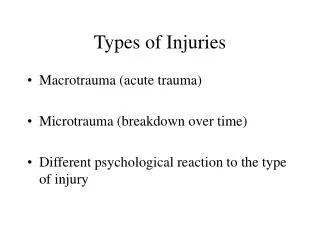
Stem Surface Injuries of several species of Columnar Cacti of Ecuador. Annarita Macri Manhattan College. Scaling and Barking. Scale injury forms when there is a buildup of epicuticular waxes. Bark injury occurs when epidermal cells proliferate and accumulate on the surfaces.

E N D
Stem Surface Injuries of several species of Columnar Cacti of Ecuador Annarita Macri Manhattan College
Scaling and Barking Scale injury forms when there is a buildup of epicuticular waxes. Bark injury occurs when epidermal cells proliferate and accumulate on the surfaces This slide shows the types of injuries that have been observed and evaluated for almost two decades for cacti. Scale injuries have been shown to occur prior to barking injuries. These injuries have been shown to precede premature death in some cactus populations. (Gibson and Nobel 1986, Duriscoe and Graban 1992, Evans 2005, Evans et al. 1994a, 1994b, 1994c, 1995).
This slide shows a Jasminoceresus thoursaii specimen along the coast of Santa Maria, Galapagos Islands.
Photosynthetic Active Radiation (PAR) • PAR is light between 400 and 730 nm • Program developed by Gary Geller • Program that calculates total PAR on a vertical surface through the entire year • Program needs latitude and direction on vertical surface N This slide provides the background for the PAR model of Dr. Gary Geller. The model measured the amounts of PAR on vertical surfaces of columnar cacti at various latitudes. Dr. Geller generated this model in the 1980s and we had a copy of the model. The model gives daily values but also had the ability to accumulate PAR over an annual cycle. E W S
1.0 32oN Arizona 1.0 4.0 20oN Central Mexico 1.0 2.0 0o Ecuador 1.4 1.4 1.0 4.0 32oS Argentina/Chile This slide shows the ratios of PAR generated by the Geller model at a variety of latitudes. At 32 degrees N and S, the PAR ratio was about 4:1, equatorial surfaces versus polar surfaces. At 20 N, the equatorial to polar ratio was 2:1. At the Equator, model predicts that the ratio of PAR at equatorial:polar surfaces will be 1.4:1. Our research in Ecuador was aimed at understanding if the ratio of injuries on columnar cacti would be 1.4:1 on stems. 1.0
North East West South Equator This slide alludes to the hypothesis that equatorial surfaces (East and West) should have 1.4 times more injuries than polar surfaces (north and south).
Galapagos Islands Equator
Species Pilosocereus lanuginosus Armatocereus cartwrightianus (A.C.)
Species Continued Jasminocereus thousarii (J.T.) Praecereus euchlorus var. diffusus (P.E.)
This slide alludes to the fact that only cacti that were not surrounded by other vegetation could be used for this study. This limited the numbers of cacti that could be used for the study. Vegetation
North 50% Measuring Injury West75% East 100% South 40%
Why Grouping? Injury Class (%) 0-14.9 15-40 40.1-55 55.1-75 >75 HEALTHY INTERMEDAITE SICK 50% 15% 95% 5% 20% 70% This slide shows the five groups that cacti were grouped into. The reason for the groupings can be found in several publications in the curriculum vitae of Lance S. Evans. The above shows three examples between two sides of a cactus.
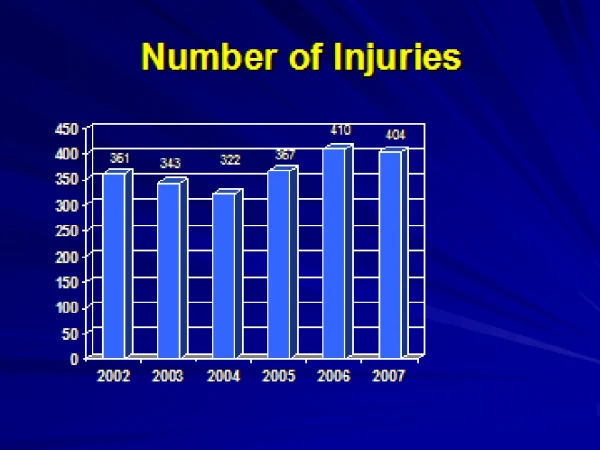
North West East South Armatocereus cartwrightianus n=99 Injury AverageAverage Class (%) W + E vs N + S 0-14.9 7.7 4.4 15-40 2715 40.1-55 4833 55.1-75 6657 >75 92 66 This slide shows the data for one of the species of this study. In all cases, the values for W + E are greater than for N + S.
Pooled data analysis of four species of columnar cacti of Ecuador Injury Equatorial PolarEquatorial/Chi-square Class n surfacessurfaces Polar (%) mean (standardmean(standardratio X2Probability deviation)deviation) value value 0-14.9 188 7.3(3.4)4.8(5.7) 1.52 201 <0.01 15-40 222 26.1(8.2)18.7(9.8)1.40 215 <0.01 40.1-55 64 49.1(4.1)35.9(6.9)1.37 93 <0.01 55.1-75 85 66.5(5.9)53.4(8.3)1.25 122 <0.01 > 75 65 87.2(6.5)70.6(12.1)1.24 104 <0.01 This slide shows the analysis of the data for all four species of this study. In all cases, the values for equatorial surfaces were statistically higher than values for polar values. Note the ratios of from 1.24 to 1.52. Note the chi-square values and the probability values of less than 0.01. These results support our hypothesis that equatorial injuries were about 1.4 times greater than on polar surfaces.
y=0.91x + 0.07 R2 =0.91 This slide shows the relationship between the ratio of injuries and ratio of PAR. Note the slope of 0.91 with an r2 value of 0.91. The data from Ecuador were at a ratio of 1.4.
Ratio of Equatorial to Polar Injuries Latitude (degrees) y=0.003x2 - 0.028x + 1.37 R2 = 0.88 This slides shows the relationship between the ratio of injuries and latitude on the Earth’s surface. Note the equation in which the data at the equator are at 0 degrees. Overall, the data support our hypothesis that cacti at the equator have about 1.4 times more injuries on equatorial surfaces than on polar surfaces.