Download
1 / 29
290 likes | 306 Views
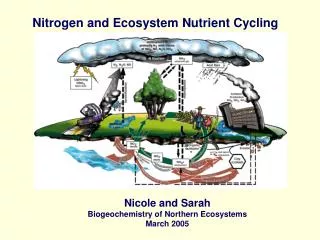
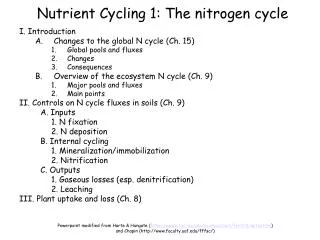
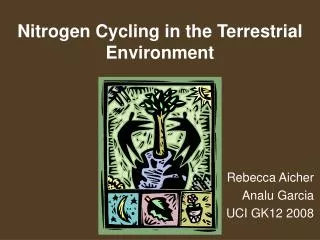
Chapter 4 Decomposition and Nitrogen Cycling Spring 2017. Nitrogen Cycle. Simple Organic N. NH 4 +. NO 3 -. Mineralization. Immobilization. Nitrogen Loading is already damaging the biosphere wet/dry N Deposition rates ( 0 – 60kg/ha/yr ). Galloway et al Science 2008.

E N D
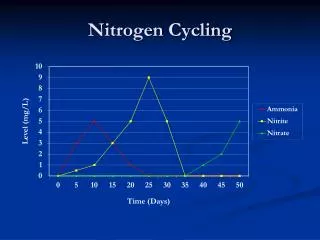
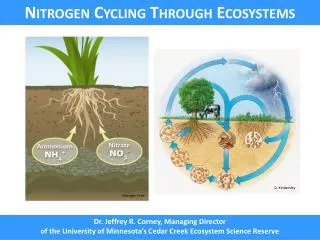
Nitrogen Cycle Simple Organic N NH4+ NO3- Mineralization Immobilization
Nitrogen Loading is already damaging the biospherewet/dry N Deposition rates ( 0 – 60kg/ha/yr ) Galloway et al Science 2008
Ecosystem Impacts from Nitrogen Loading Nutrient enrichment impact on native grassland • Loss of Biodiversity and productivity decline • Alteration of soil/plant community structure • Eutrophication • Soil Acidification • Variable impacts depending on climate, geology, plant community type
Future Phosphorus Limitations ? Cordell et al 2009. Global Env Change 19: 292-305
PLANETARY BOUNDARIESRockstrom et al. 2009 Nature 461 Related to NPP
Deposition 1, 10, 50 kg/yr Precipitation 100 kg 100 kg Litter Fall Fixation 30 kg/yr Uptake 500 kg 50 kg Soil Chemical Reactions 3000 kg Leaching Decomposition 50 kg/yr Weathering Rock
Larch Fir Growth N Demand: Stem 2 2 Needles 100 (100% turnover) 20 (20%) 102 22 N Supply: Retranslocation 50 10 Decomposition 51 11 Atmosphere ANNUAL N Req. 1 1 102 22
Decomposition is the Result of 3 Simultaneous Processes • Leaching • Weathering • Biological activity
NITROGEN Vegetation Litter Humus ATMOSPHERE Gaseous losses (e.g., respiration, denitrification) Precipitation Fixation SOIL ORGANIC Microbes Decomposition Retranslocation Mineralization Immobilization Throughfall, exudation SOIL INORGANIC Uptake Soil Solution Exchange Sites Exchange PLANTS Fig. 14.2 p. 255 Leaching GROUNDWATER
Litter Quality & Decomposition • Type of chemical bonds and amount of energy released by decay (carbon quality) • Size and 3-D complexity of molecule • Nutrient concentration (nutrient quality)
100 Boreal 75 Missoula % Dry Weight 50 Seattle 25 Tropics 0 0 1 2 3 4 5 Time (years) Climate Controls on Decomposition
100 75 Pine (20% Lignin) % Dry Weight 50 Maple (10% Lignin) 25 Tomato (0% Lignin) 0 0 1 2 3 4 5 Time (years) Leaf Decomposition Rates
Decomposition • Glucose, simple sugars • Cellulose* • Tannins & Lignins
Fig. 13.1 p. 229 Remaining Mass Phase regulated by nutrient level and readily available carbon Phase regulated by lignin decomposition rate N, P, S, “HLQ” solubles “HLQ” Nitrogen Nitrogen Time
Fig. 13.2 p. 231
Decompositionof an abscisedleaf with(a) high (25%) and(b) low (5%)lignin content Fig. 19.11 p. 555
Decomposition • Glucose, simple sugars
Decomposition • Cellulose
Decomposition Tannins & Lignins
0.096 0.24 0.080 0.20 0.064 0.16 Percentage of nitrogen Percentage of phosphorus 0.12 0.048 0.08 0.032 0.04 0.016 Sand and loamy sand Sandy loam Silt loam Silty clay loam Loam Clay Percentage of clay Fig. 12.13 p. 222
Humus Humus is a complex & amorphous form of organic matter in ecosystems. It is high in nitrogen and large polyphenolic molecules, but low in cellulose. It can take thousands of years to decompose.
Clay – organic matter complex Open pore Bacteria Quartz Pore opening Closed pore Fungal hyphae Clay domain Organic matter- Sesqui oxides Model of a Soil Aggregate
Example Model Representation of Soil Decomposition & Respiration(BIOME-BGC) • Multiple SOC pools with cascading litter quality from small, labile litter pool (rapid decomp) to large, recalcitrant (slow decomp) SOC pool. • Decomp and respiration rates influenced by C:N ratio, soil moisture and temperature conditions. http://www.ntsg.umt.edu/project/biome-bgc
Model Parameterization using Global Observations Respiration Sites from TRY Database Autotrophic Heterotrophic Reco = fautGPP + f(Tsoil) f(SM) SOC Soil Respiration (Rh) Hursh et el. 2016. Global Change Biol. Soil Moisture (%Sat)