Download
1 / 17
170 likes | 182 Views
Comparative analysis between ENTEx and GTEx gene expression profiles from various tissues, including clustering, correlation analysis, differential gene expression, and tissue-specific gene identification.

E N D
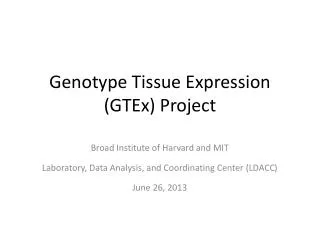
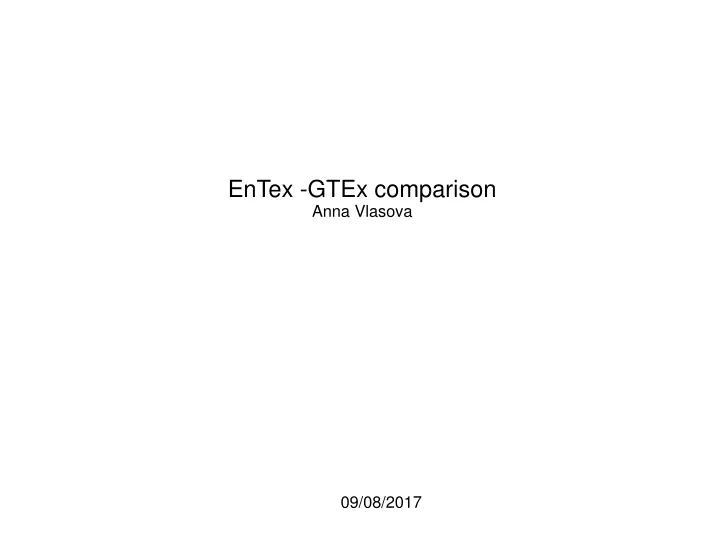
EnTex -GTEx comparison Anna Vlasova 09/08/2017
ENTEx 97 samples from 27 tissue subregions (SMTSD values) Reads mapped to the GRCh38, gencode24, STAR+RSEM pipeline GTEx 95 samples from 30 tissue subregions (SMTSD values) Reads mapped to the GRCh38, gencode26, STAR+RSEM+RNASeQC pipeline GTEx only tissues: Whole Blood Artery – Tibial Esophagus – Muscularis Artery - Coronary ENTEx only tissues: Peyers patch In total there are 79 matched samples, both tissue and individual. For 7 samples EnTex has replicates. Note: EnTex and GTEx samples have different notation of the tissues, i.e. esophagus mucosa == Esophagus – Mucosa esophagus squamous epithelium =? Esophagus – Mucosa
Number of genes with TPM>=1 per sample Entex data – 86 samples, GTEx – 79 samples, matched tissues
Number of genes with TPM>=1, summary by study Entex data – 86 samples, GTEx – 79 samples, matched tissues
t-SNE clustering, using tissue specific genes from GTEx, 2,908 genes
Clustering of the samples based on the pearson correlation, protein coding genes
Pearson correlation for paired samples only, 72 samples, for protein coding genes Calculated on log2(TPM+0.1)
Pearson correlation for all genes, calculated on log2(TPM+0.1) Muscle-Sceletal, ENC003, cor=0.94 Stomach, ENC004, cor=0.82
Cellular decomposition in EnTex and GTEx samples, by applying Alessandra's method.
Cellular decomposition in Esophagus-Mucosa samples Annotation: esophagus muscularis mucosa Annotation: esophagus squamous epithelium
Differential gene expression(DGE) between Gtex and Entex samples Lowly expressed genes Number of DGE genes between studies when using all tissues: Up-regulated in Entex – 1,059 Up-regulated in GTEx – 1,587 edgeR, logFC>=2, FDR<=0.05
70 genes differentially expressed between GTEx and EnTEx in all tissues. log10(TPM+0.1)
Genes expressed only in Entex samples those reported lack a polyA tail: • Histone genes (HIST4H4, HIST1H2BC, HIST2H2AC, and some more), • the RNA component of RNase P (RPPH), • the RNA component of telomerase (TERC) • Zinc finger protein ZNF460 Genes expressed only in GTEx samples: • Many antisense and TEC(To be Experimentally Confirmed) genes • Protein coding genes with tag "overlapping_locus" • Located in chrM Yang et al., Genome wide characterization of non-polyadenylated RNAs, Genome biology 2011
Expression pattern for 71 histone gene, protein-coding only. log10(TPM+0.1)