Download
1 / 24
240 likes | 390 Views
Tic-Tac-Tolerance. Steve and Torsten. Introduction. We decided to play Tic-Tac-Toe with subjects in order to test mean number of games played We are looking to see just how competitive people can be when it comes to a simple game like Tic-Tac-Toe. Summary of Topic and Data Collection.

E N D
Tic-Tac-Tolerance Steve and Torsten
Introduction • We decided to play Tic-Tac-Toe with subjects in order to test mean number of games played • We are looking to see just how competitive people can be when it comes to a simple game like Tic-Tac-Toe
Summary of Topic and Data Collection • With each subject we played Tic-Tac-Toe with, we recorded the game length, and thereby average time per game, total games, and each game’s outcome to measure competitiveness • We would ask every third person to walk by our setup in Doylestown or the school if they would like to play • After each game we would ask subjects if they would like to play again, and continued this until they decided they were done.
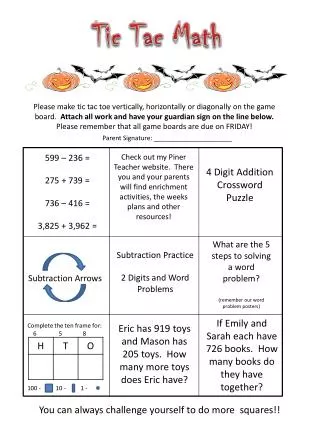
What is this “Tic-tac-Toe” of which you speak? • You might know it as Noughts and Crosses • Tic-Tac-Toe is a strategy game played with a grid of 9 squares where players alternate playing X’s or O’s • Many believe it to be the FIRST strategy game, EVER • It is played almost universally
Games Played vs. Win % The scatterplot is very roughly positive, very weak, and barely linear. In fact, the correlation, r, is only 0.014. Just from the scatterplot, we can conclude that playing more games is not guarenteed, or likely, to increase your win percentage (defined by total wins/total games played)
Game Time vs. Wins The scatterplot is roughly linear, negative, and weak. The r is 0.221 We can conclude from this graph that longer games do not correlate well with number of wins. This could be extended to mean that thinking moves through, and taking longer per turn, is not likely to increase your number of wins.
Game Time vs. Setting The classroom/school setting box plot is right skewed. The outside setting plot is roughly symmetric. The classroom setting’s median is much higher than the outdoor setting’s, 195 seconds as opposed to 61.5 seconds. The classroom’s total game times were also much more spread out than the outside’s total game time. The IQR of school games was 200.5 seconds, compared to outside’s IQR of 50 seconds. Here we can see that people in a school setting are much more willing to be distracted for a longer amount of time than those outside.
“Hi, would you like to play some Tic Tac Toe-” OHH I’M SO BAD AT TIC TAC TOE! DOESN’T NOBODY EVER WIN? “No, actually we get a lot of wins, and some losses, but yes people tie pretty often-” YEAH ITS IMPOSSIBLE TO WIN BUT OKAY I’LL PLAY A LITTLE! IT’S JUST GOING TO BE A TIE THOUGH!
Testing Wins State Check 1. SRS 2. 3. • Stated • (66)(0.394) >10 • (66)(.606) > 10 • 3. All Tic-Tac-Toe Players > 660 Conditions metNormal Model1 prop Z test
Testing Wins P = 0.042 Z = -1.723
Testing Wins • We reject the because • We have sufficient evidence to conclude that a tic-tac-toe player will win 0 games less than 50% of the time. • So, yes, Tic Tac Toe IS fun AND possible to win.
Testing Game Time with Age State Check Stated All people over 25 > 180 All people under 25> 480 3. Both normal probability graphs are linear, and therefore normal • SRS 2. • Or Normal data Conditions met Student’s t-distribution 2 sample t test Df = 61.758
Testing Time with Age p =5.06x10-⁷ t =-5.429
Testing Time with Age • We reject the because • We have sufficient evidence to conclude that people under the age of 40 will on average play longer games of tic tac toe than people over 40.
Testing Competitiveness with Gender State Check Stated All males over 25 > 180 All females under 25> 480 3. Males=31 > 30 Females=35 > 30 • SRS 2. • Or Normal data Conditions met Student’s t-distribution 2 sample t test Df = 63.9907
Testing Competitiveness with Gender t =-0.3945 p =0.69
Testing Competitiveness with Gender • We fail to reject the because • We have sufficient evidence to conclude that both males and females are equally competitiveness in the number of tic-tac-toe games they will play.
Conclusions • Men and women appear to be equally competitive, contrary to stereotype • Older people are less willing to become competitive (with strangers) • Tic-tac-toe will often have a winner! So play, play away! • Don’t think too much. It usually wont help your TTT game. • Quit while you’re ahead. • The Classroom is a place for distraction
Opinions • Tic Tac Toe is awesome! • But tiring. • We may have needed to cut some people off at some point • People will actively avoid anybody with a booth in Doylestown • 8 year olds are good at Tic Tac Toe • Steve is better than Torsten at Tic Tac Toe, and takes less time • Protip: For a fun game, don’t go in the middle. It always ends in a tie
Applications • The population of adults are significantly less willing to be competitive with strangers • The population of women and men are equally competitive. • The population of tic-tac-toe players will win 0 zero games less than 50 percent of the time. It’s statistically verified as fun. • The population of classroom players are far more willing to divert themselves with games. • So, perhaps, more games?
Bias/Error • The way in which we ask people for new games could influence our data. Sometimes we simply drew a new grid, or egged them on, or asked plainly “Want to play again?” • Our conversations during play could also influence whether people feel comfortable staying around and playing • We may have had error in starting and stopping the timer occasionally