Download
1 / 23
230 likes | 382 Views
CHOOSE YOUR RATE, CHOOSE YOUR FATE? Matching Navy Recruits to Jobs (MINIMUM-COST FLOW MODEL). Kyle Alcock Jemar Ballesteros Tim Shaffer. BACKGROUND Labor Economics. Issues : No lateral entry into the Navy Attrition = loss of return on investment

E N D
CHOOSE YOUR RATE, CHOOSE YOUR FATE?Matching Navy Recruits to Jobs(MINIMUM-COST FLOW MODEL) Kyle Alcock Jemar Ballesteros Tim Shaffer
BACKGROUND Labor Economics • Issues: • No lateral entry into the Navy • Attrition = loss of return on investment • Low retention = need to replace with new recruits • Expensive training cost per new recruit • Training cost is Navy’s investment; 4/5 yr. contract is return on that investment • Better investment = reenlistment 5
BACKGROUND • Rate selection Training pipeline Fleet • Wants of the recruit vs.Needs of the Navy • Motivation Behind Model: • Sailors who remain happy with their job match are less likely to attrite and more likely to reenlist and perform well • Maximize Human Capital • Right person, right place, right time…
BACKGROUNDBUSINESS PROCESS • Force management effects (PTS, ERB) • Current process – FCFS, “needs of the Navy” • Thought process for improving Human Capital: • Provide recruit’s top rate choices
ASSUMPTIONS • No attrition throughout the network • Have to set pool of recruits but not necessarily use all into the model • Assignment process is discretized (in fact, it is a time continuous process) • Pool is ‘high-quality’ recruits • Only 15 technical ratings
Network Example (Simplified) (0, 0, 45) (-0.4, 0, 1) (-1, 0, 1) (0, 0, 1) (0,29, 65) (0, 0, ∞) Objective: Deliver maximum Human Capital to the Fleet, subject to the network constraints.
Intuition • Possible Flow Inhibitors: • Recruit quality • High rating selectivity • Limited schoolhouse capacity • Fleet demand signal • Rating demand vs. recruit preferences
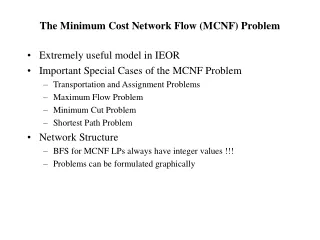
Min Cost Flow Objective • Minimize the cost of flow from recruit pool to the Fleet • Equivalent to maximizing human capital delivery subject to needs of the Navy
Rating Preference Fulfillment Capital = 415.6 Recruits Assigned to Jobs = 460
Network Design: Scenario • Schoolhouse capacity limitations recognized • Naval Education and Training Command (NETC) has proposed to augment traditional schoolhouse training with a limited number of computer-based training (CBT) courses to increase training throughput.
Network Design: Action • NETC can fund up to 5 CBT courses for the following ratings only: • ET, IT, OS, GSE, FC, CTT, EM • Task: Determine optimal choice of CBT augmentation course offerings. • NETC wants to see the marginal improvement for adding CBT courses, up to the max of 5.
Network Design Example (-0.4, 0, 1) (0, 0, 45) (0.3, 0, 15) (-1, 0, 1) (0, 0, 1) (0, 0, ∞) Objective: Improve the delivery of Human Capital as much as possible by choosing which CBT augmentation courses to offer.
Rating Preference Fulfillment, 1 CBT IT CBT course added Capital delivered = 429.6 % increase: 3.37% Recruits Assigned to Jobs = 480
Rating Preference Fulfillment, 2 CBT OS CBT course added Capital delivered = 439.4 % increase: 5.73% Recruits Assigned to Jobs = 493
Rating Preference Fulfillment, 3 CBT GSE CBT course added Capital delivered = 445.4 % increase: 7.17% Recruits Assigned to Jobs = 500
Rating Preference Fulfillment, 4 CBT EM CBT course added Capital delivered = 448.3 % increase: 7.87% Recruits Assigned to Jobs = 500
Network Design: Summary • Objective function improves due to: • More people assigned jobs (more flow) • Higher preference fulfillment
Schoolhouse Seat Allocation • Multi-commodity flow model with 10 different recruit batches • Schoolhouse capacities now decision variables • Total schoolhouse seating still constrained • Goal: Given recruit batches of varying AFQT quality and different preferences, set optimal school seat capacitiesto fulfill projected future rating demands. • Ran with batch sizes of 100 recruits
Limitations and Future Work • Multi-objective utility function • Time-layered model • Recruiting is seasonal and time continuous • Expand scope to include all ratings • Use real recruiting data and capacities • Proposal for business process change: • ‘Rack and Stack’ draft process