Download
1 / 5
50 likes | 76 Views
Explore the visual representation of motion through various graphs illustrating distance changes over time. Learn how different lines and patterns indicate different types of motion and understand the concept of constant and changing distances.

E N D
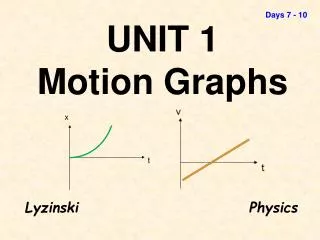
Motion Graphs Time – Distance Graphs
Motion Graph # 1Straight, Flat Line • As time passes, there is no change in distance; no motion
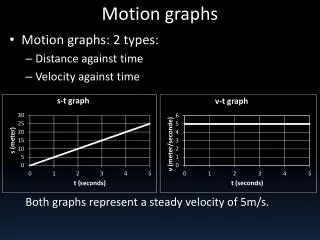
Motion Graph # 2Straight, Increasing Line • As time passes, distance increases • The change in distance in constant – no stopping & starting
Motion Graph # 3Straight, Decreasing Line • As time passes, distance decreases • The change in distance is constant
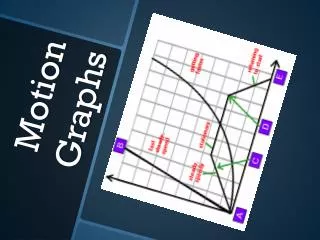
Motion Graph # 4Changing Line • A changing line means changing distance • Distance increases doesn’t change decreases