Download
1 / 2
20 likes | 163 Views
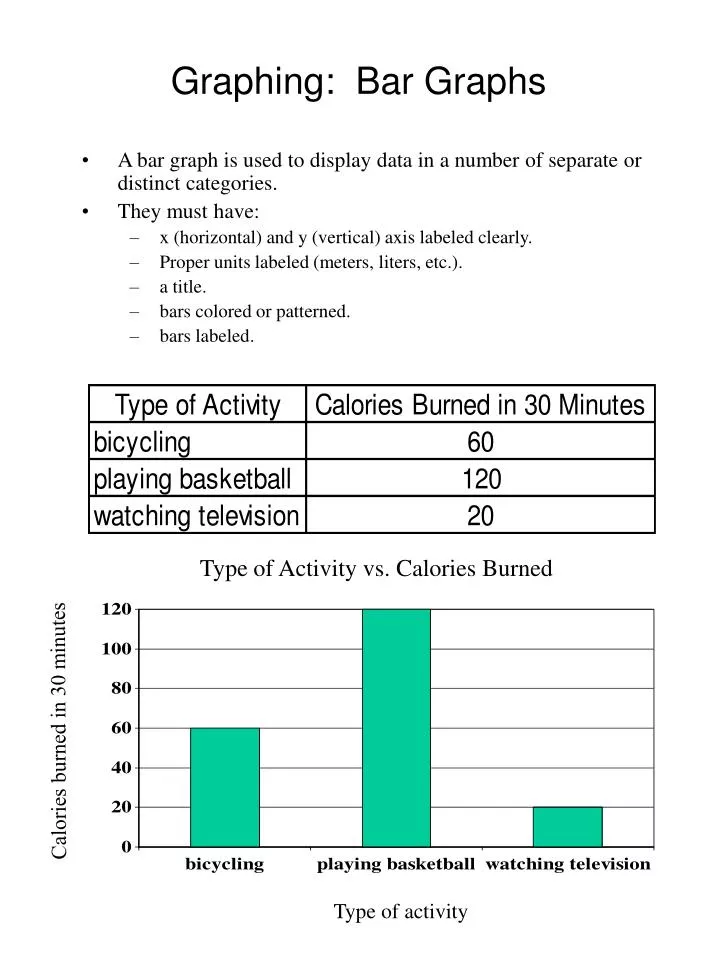
Graphing: Bar Graphs. A bar graph is used to display data in a number of separate or distinct categories. They must have: x (horizontal) and y (vertical) axis labeled clearly. Proper units labeled (meters, liters, etc.). a title. bars colored or patterned. bars labeled.

E N D
Graphing: Bar Graphs • A bar graph is used to display data in a number of separate or distinct categories. • They must have: • x (horizontal) and y (vertical) axis labeled clearly. • Proper units labeled (meters, liters, etc.). • a title. • bars colored or patterned. • bars labeled. Type of Activity vs. Calories Burned Calories burned in 30 minutes Type of activity
Your Assignment • You must make a bar graph using the following data. Make sure you follow the guidelines from the front side of this handout. • You must make a bar graph using the following data. Make sure you follow the guidelines from the front side of this handout.