Download
1 / 17
170 likes | 199 Views
This report provides an overview of Korea's energy status, achievements to date, and national programs for new and renewable energy. It covers energy consumption, CO2 emissions, NRE sources, industrial ecosystem, and government support.

E N D
New and Renewable Energy Status & Policies of Korea Oct. 2012 Chang-goo KIM Director, NRE Promotion Department, New and Renewable Energy Center(NREC) of Korea Energy Management Corporation (KEMCO)
Contents Ⅰ Energy Status in Korea Ⅱ Achievements to Date Ⅲ National NRE Programs
Ⅰ Energy Status in Korea
Energy Consumption Crude Oil Import Energy Status 8th biggest energy consumer in the world (262.6Mtoe) Source:KEEI 5th biggest importer, 68.7 billion USD (accounting for 56% of all energy import) Source:KEEI CO2 Emission 7th biggest Emitter in the world, 590Mtoe Source:European Commission’s Joint Research Center & PBL Netherlands Environmental Assessment Agency, 2012 2010 121.6 billionUSD (Energy) 179 billionUSD (Car(82) +Semi-conductor(49)+ Shipbuilding(48))
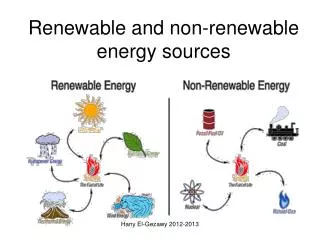
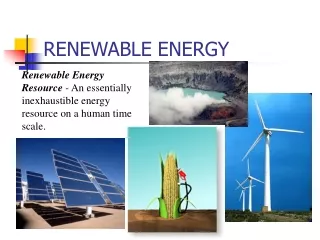
NRE Share in TPES (%) 2.24 2.24 2.37 2.37 NRE Status New and Renewable Energy Sources in Korea • RE : 8 Sources • PV, Solar Thermal, Wind, Waste, Bio(LFG, Bio-Fuels), Hydro, Geothermal, Marine • New Energy : 3 Sources • - Fuel-cell, Hydrogen, Coal Liquefaction or Gasification < Breakdown of NRE share (2010) > Bio 11% Wind 2.6% PV 2.4% Fuel Cell 0.6% Waste, Hydro account for the most proportion 82.5% 2.61 2.61 Waste 70.9% 2.50 2.50 2.43 2.43 Hydro 11.6% ’10 ’06 ’07 ’08 ’09 Annual Growth Rate : 7.0% (`06~`10) Increase National NRE Supply Target : 11% by 2030 Prospect for each NRE Sources’ Growth Rate by 2030 PV(15%), Wind(18%), Bio(15%) Waste(4%), Hydro(2%) Decrease
Ⅱ Achievements to Date
Achievements Establishment of industrial ecosystem Strong government support Active Participationby SMEs & Large Conglomerates • Building the value chain & business system based on collaboration between SMEs & large conglomerates Regarded as a main source of SMEs’ growth & Job Creation & the new profitable area of large conglomerates No. of manufacturers No. of employees Sales (bil.USD) Exports (100mil. USD) 8.07 45.3 13,651 212 3.7 times 6.5 times 7.3 times 2.1times 10,395 26.7 4.74 193 3,661 101 6.2 1.24 ’07 ’09 ’10 ’07 ’09 ’10 ’07 ’09 ’10 ’07 ’09 ’10
Existing industrial ecosystem Foster the Second semiconductor industry based on the mutual development of large and small companies and job creation PV New era of GW scale power production by an integrated production system from Poly silicon to system Poly silicon (tons) Ingot/Wafers (MW) Cells (MW) Modules (MW) 2,908 1,831 31,600 1,915 17,100 1,140 921 1,000 173 36 200 0 ’07 ’09 ’10 ’07 ’09 ’10 ’07 ’09 ’10 ’07 ’09 ’10 Increasing exports in all areas such as materials and modules including Equipment and turnkey orders Equipment Export Exports 3,744 (unit: Million USD) Jusung Engineering (130mil.USD to China), Toptech(14.5mil.USD to China) 1,723 Large-scaled Plant Export Samsung C&T Corp.(500MW Canada,130MW US) SDN(45MW Bulgaria) Hyundai Heavy Industries Co.(175MW US) 142 6 ’04 ’07 ’09 ’10
Model sector for SME-LE to co-prosper Growing up as the 2nd shipbuilding industry A high potential of becoming the leading group combined with key industries Wind Industrial structure building with collaboration between SMEs for components & large enterprises for finished goods Category Major companies Blade KM, Deck, Doha Industry, GwangdongFRP, HwashinFRP Tower Parts DongkukS&C, Unison, CS wind, Speco, Win&P Component Taewoong, Pyungsan, YonghyunBM, Hyunjin Materials, Unison, Mysco Doosan, Hyundai, Hyosung, STX,Samsung heavy industries, DSME System Trends towards increasing exports of wind power system as well as tower & machined parts Exports (unit: million USD) Wind Power Export 788 Hyundai Heavy Industries (Pakistan,49.5MW, 1.65*30) STX(The Netherlands,50MW, 2*25) Unison(Sri Lanka, 9.7MW, 750kW*13) 475 58 ’04 ’07 ’10
Ⅲ National NRE Programs
9,216 9,216 1,879 3,709 1,879 3,709 Expected Values Expected Values Projects for Large-scaled Market FIT ( Feed in Tariff, 2002 ~ 2011) NRE Plants : 2,108Power Generation : 10,129GWh, Supported Budget : 1,141bil KRW (951mil USD) RPS (Renewable Portfolio Standards, 2012) Target : To Realize National Target, 11% of NRE Share in TPES, Launched in 2012 13 Mandatory Power Companies with Capacity of More Than 500MW Power Plants Obligatory NRE Production Ratio in their total Power Generation 0.5%p ↑ 1.0%p ↑ Responsible for 50% of Targeted NRE Supply Amount By 2020 Inducing Market Investment of 48bil USD (Unit: thou TOE) Reduction 16mil tons of CO2 Annually (Reference) 2020 NRE Supply Target : 17,520 thou TOE 2012 2015 2020
Projects for Large-scaled Market Mandatory Use for Public Buildings (2004~2011) Obligated new buildings of public institutions with the floor area exceeding 3,000㎡ to use more than 5% of total construction expenses to install NRE systems Public Institutions : State administrative bodies, Local autonomous entities and State-run companies Revision of Obligation Program for Public Buildings (2012~) Mandatory Use and Design with NRE of more than 10% of total energy load fornew, renovated and expanded public buildings over 1,000㎡
Subsidy & Loan Programs General Subsidy Program (1993~ ) Subsidize part of the installation costs of NRE facilities to enhance NRE deployment and to relieve end-user’s cost burden (Factories, Individual Buildings, Schools) Focusing on PV, fuel cell, wind and bio-energy 1 Million Green Homes Program (2009~ ) Expanded former ‘100,000 solar roof program’ to promote residential NRE deployment Aiming to disseminate 1 million green homes by 2020 Local NRE Deployment Program (1996~ ) Support various NRE deployment projects by local governments for public buildings, social service facilities and remote area’s residents, etc. Loan & Tax Deduction Program (1983~ ) Provide low-interest loan Corporation tax deduction : 10% of total investment in NRE
1 Million Green Homes Program Goal: Achieving Green Life by Deploying 1 Million Houses with NRE Facilities Attached NRE Facilities: PV, Solar-Heating, Geothermal, Fuel Cell, Small Wind, Wood Pellet Promotion period: 2009 ~ 2020 Building 1 Million Green Homes by 2020 New & Renewable Energy (Active) Energy Efficiency Improvements (Passive) 1 Million Green Homes Remodelingof Existing NRE Attached Houses 93% of heating Cost Reduction 50% of Cooling Cost Reduction Solar-thermal water heating system PV power system Heat recovery & Ventilation System LED lights Automatic window system Geothermal heating & Fuel-cell system &Wood Pellet Boiler BIPV Door Insulation Enhanced external insulation 1 Million Green Homes Showcase
Offshore Wind Project Wind Energy Top-3 Roadmap Roadmap to become World’s top-3 position in international wind market (Nov, 2010) “Technology Development – Demonstration – Expansion international Market Share” To Secure ‘Track Record’ 2012 : Development of 5MW Offshore Wind Generators 2013 : Building a 100MW Demonstration Complex (5MW × 20) - South-west Coast Area • ‘Offshore Wind Promotion Committee’ under Operation Scaling up the Capacity of Wind Complex by total 2.5GW (5MW × 500) by 2019 1st Phase(~2014) : 100MW Demonstration Complex 2nd Phase(~2016) : 900MW Pilot Complex 3rd Phase(~2019) : 1.5GW Large Scaled Wind Farm - 7.5bil USD Will be Invested in the Project in Partnership with Private Sector - Enhance the Installation Capacity up to 7.7GW with Local Governments after 2019
The target to be the world’s top 5 nation in NRE market Vision 2015 International market share : PV15%, Wind15% Private Investment Sale Export Employment 7.2 110 (unit: bilUSD) (unit: bilUSD) (unt: 0.1bilUSD) 41.7 37 (unit: 1,000 employees) 4.8 2.6 16.7 11 27 9 3.3 2 ’09 ’12 ’15 ’09 ’12 ’15 ’09 ’12 ’15 ’09 ’12 ’15 Invest 33 bil.USD (private 28, government 5) by 2015
Thank you very much! kcg@kemco.or.krChang-goo Kim, Director of NRE Promotion Department New and Renewable Energy Center(NREC) of Korea Energy Management Corporation(KEMCO)