Download
1 / 22
230 likes | 259 Views
Develop a system for evaluating corrosion defects in pipelines using FEM, safety diagrams, and simplified defect geometries. Validate failure criteria, predict failure pressure, and create safety diagrams for effective risk management.

E N D
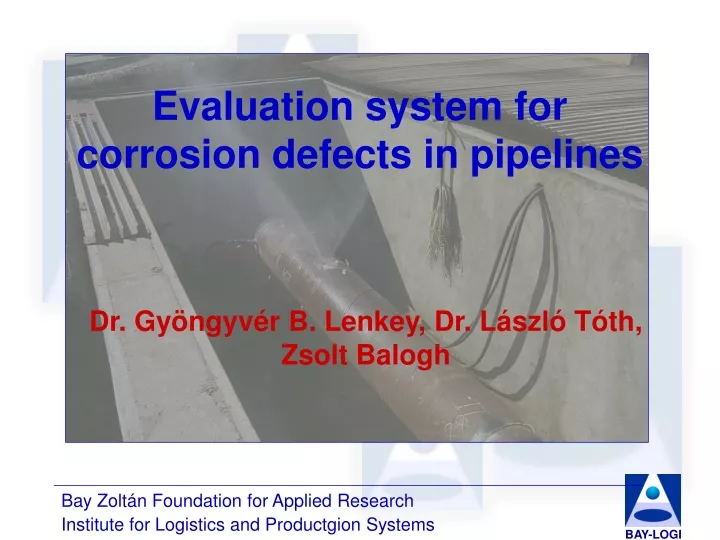
Evaluation system for corrosion defects in pipelines Dr. Gyöngyvér B. Lenkey, Dr. László Tóth, Zsolt Balogh
Objectives of the work • Evaluation of the applicability of FEM for predicting the failure pressure and the safe operation pressure for corroded pipelines • Development of safety diagrams • Development of evaluation system for corrosion defects
Previous projects • Development of FEM model with real defect geometry • Development of simplified defect geometries and comparative assessment • Comparison of FEM results with pressure tests and with engineering methods • Development of failure criteria for failure pressure
Mapping the real 3D defect geometry Laser distance measurment Sample (negative)
Boundary conditions for FEM model Modelling the pressure test: • Quarter modell • Increasing internal pressure • Increasing axial tension (proportional with the pressure)
Parameters of FEM calculations • Elastic-plastic material law (determined from tensile tests, ReH=350 MPa, Rm=480 MPa) • Von-Mises yield criteria, isotropic hardening • Large deformation option
Development of simplified defect geometries Parabolic modell Rectangular modell 6th order surface modell
Validation of failure criterion and applicability of simplified geometries s Criterion: = R ' eq m 25 20 15 Pressure, MPa 10 Real defect Rectengular modell 5 Parabolic modell 0 Measured failure pres. 0 1 2 3 4 5 6 7 6th order modell Defect depth, mm
Comparison of measured and predicted failure pressure values – with engineering methods Pressure, MPa Defect depth, mm Meas. fail. pres.
Objectives of the present project • Performing large number of FEM calculations with simplified defect geometry (parabolic) • Development of safety diagrams and defect evaluation system
Basic data for the FEM calculations • Different pipe geometry (diameter, wall thickness) • Different materials • Different defect sizes (d, L, b)
Development of safety diagrams • Different representation possibilities (as a function of L/D, d/t, L or d) • E.g. normalisation of critical pressure values: • for pF-flawless=2.Rm'.t/(D-t), • 1. norm - pys= pys/ pF- flawless, • 2. norm - pyf= pyf/ pF- flawless, • 3. norm - pF= pF/ pF- flawless, • 4. norm - pü= pü/ pF- flawless.
Normalised pressure values vs. L/D –comparison with the operation pressure
Final safety diagrams For Pys
Definition of safety factors • For the critical pressure values: • n1=Pys/Pü for the beginning of plastic deformation • n2=Pyf/Pü for the localisation of the plastic deformation (contraction) • n3=PF/Pü for the failure (plastic instability) • Operational safety? – combination of n1, n2, n3 – application possibility of risk based approaches – owner’s responsibility!
Summary and conclusion • FEM calculations gave more accurate prediction for the failure pressure than engineering methods. • The predicted failure pressure (based on FEM calculations) were in good agreement with the pressure test results. • Simplified defect geometries could be applied for predicting the failure pressure, so it gives opportunity to perform large number of FEM calculations and development of safety diagrams. • With the application of the safety diagrams a proper safety evaluation system can be developed together with the owner. • Possibility for more complex safety assessment system and application of risk based principles.