Download
1 / 13
130 likes | 253 Views
Effect of BrO Mixing Height to Ozone Depletion Events. Sunny Choi. Ozone Depletion Events (ODEs). Low O3 events in polar boundary layer during early springtime [Oltmans et al., 1981] O3 is destroyed by reactive Br radicals [Barrie et al., 1988]

E N D
Effect of BrO Mixing Height to Ozone Depletion Events Sunny Choi
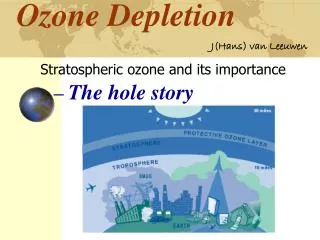
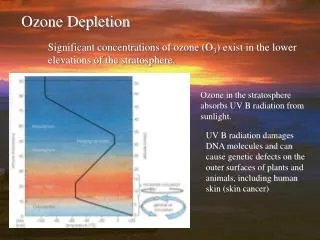
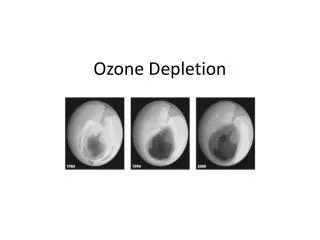
Ozone Depletion Events (ODEs) • Low O3 events in polar boundary layer during early springtime [Oltmans et al., 1981] • O3 is destroyed by reactive Br radicals [Barrie et al., 1988] • BrO is dominant species among reactive Br species during ODEs [Hausmann and Platt, 1994] • ODEs change oxidative pathways and removal process of atmospheric trace species, and may have impacts on local and global environment
BrO Chemistry of ODEs Gas phase O3 hv BrO Br Br2 Aldehydes Alkenes HO2 hv hv HBr HOBr BrCl Condensed phase (liquid brine or ice surface) H+, Cl- Br- HOBr BrCl Br2 H+, Br-
Importance of BrO Mixing Height in ODEs • O3 loss rate is proportional to the second order of BrO concentration • Br + O3 BrO + O2 • BrO + BrO 2Br + O2 (slow, Rate Determining Step) • d[O3]/dt = -k1[BrO]2 • Shallow boundary layer height is prerequisite for ODEs • Different BrO mixing heights can result in significant difference even with the same amounts of tropospheric BrO
Boundary Layer Heights for ODEs in Previous Studies • Box models considering NOx and CH2O flux from snowpack • 400m (Michalowski et al., 2000) • 200m (Evans et al., 2003) • 1-D model considering bromine chemistry • 300m (Piot and Glasow, 2008) • 200m (Saiz-Lopez et al., 2008) • 3-D model considering BrO mixing layer • 400m (Zeng et al., 2003)
Model Study • 3-D Regional chEmical trAnsport Model (REAM) • Tropospheric BrO column derived from GOME-2 satellite total BrO column observation • Tropospheric BrO is uniformly distributed in a mixing layer of a fixed mixing height • Set 4 different BrO mixing heights • 200m, 400m, 600m and 800m • Compare the results to ground-based observation (at Barrow and Alert) and in-situ measurements during ARCTAS
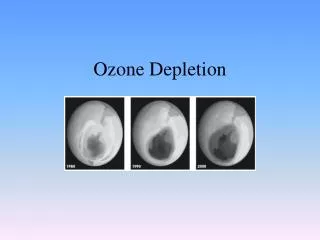
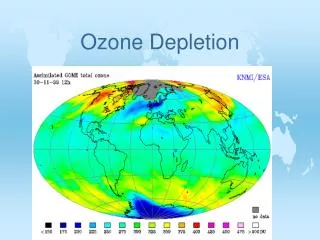
BrO Tropospheric Column and ODEs Mar 2008 • Tropospheric BrO column and monthly mean surface ozone assuming mixing height is 600m • Low ozone areas coincide with high BrO regions • ODEs are intenser in April because of longer daytime Apr 2008
Surface O3 Level at Barrow and Alert • Surface O3 depletion depends on the BrO mixing height significantly • Mixing height of 400m shows the best correlation in the simulation using GOME-2 tropospheric BrO column Surface ozone measurements by S. Oltmans (Barrow) and K. Anlauf (Alert)
Comparison to Ozonesonde Observation at Barrow • Model could not reproduce the vertical extent of ODEs • A shallow mixing height (200m) causes overestimation ODEs on the surface, but a deep mixing height underestimates. Ozonesonde measurements by S. Oltmans
Comparison of O3 Simulation to ARCTAS in-situ Observation • Correlation between all available measurements below 1km and corresponding simulations • Model reproduce the general trend, but not yet able to catch the detail • ODEs cannot happen with a deep mixing layer (800m) O3 in-situ measurements by A. Weinheimer
Comparison of O3 simulation to O3 Lidar Measurements Ozone DIAL measurements by J. Hair
Summary • Bromine-driven ODEs are simulated using a 3-D model. • The rate of O3 loss is proportional to [BrO]^2 • With fixed amount of tropospheric BrO column, variation of mixing height results in significant differences in O3 levels. • Shallow mixing heights (~200m) overestimates O3 depletions at the surface • Mixing heights of 400~600m can reproduce general features of ODEs • ODEs cannot happen with too high mixing heights (~800m)