Download
1 / 9
90 likes | 313 Views
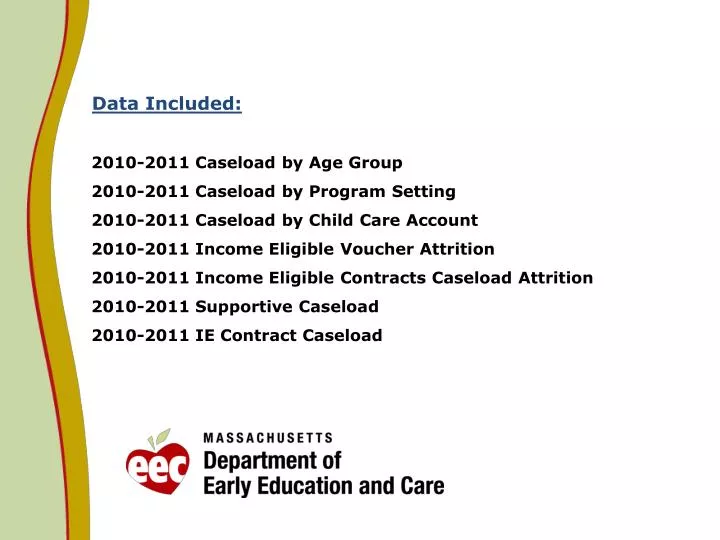
Data Included: 2010-2011 Caseload by Age Group 2010-2011 Caseload by Program Setting 2010-2011 Caseload by Child Care Account 2010-2011 Income Eligible Voucher Attrition 2010-2011 Income Eligible Contracts Caseload Attrition 2010-2011 Supportive Caseload 2010-2011 IE Contract Caseload.

E N D
Data Included:2010-2011 Caseload by Age Group2010-2011 Caseload by Program Setting2010-2011 Caseload by Child Care Account2010-2011 Income Eligible Voucher Attrition2010-2011 Income Eligible Contracts Caseload Attrition 2010-2011 Supportive Caseload2010-2011 IE Contract Caseload
Standard Deviation: Infant: 198; Toddler: 422; Preschool: 935; School Age: 1,546; Total: 1,802 Avg. = Average (2/01/10 – 1/01/11)
Standard Deviation: Center based : 1,414; Family Child Care: 482; In-Home: 159; Total: 2,065 Avg. = Average (2/01/10 – 1/01/11)
Standard Deviation: ARRA: 194; DTA: 931; Income Eligible: 1,822; Supportive; 327 Total: 1,948 Avg. = Average (2/01/10 – 1/01/11)
Standard Deviation: Vouchers: 335; Supportive Expansion: 527; Regular Slots: 457; Total: 347 Avg. = Average (2/01/10 – 1/01/11)
Notes: Caseload defined as children served and billed for in the month. (not children placed in care on a given date or “point in time.”) Income eligible flex includes ARRA funded children supported by flex funding. Standard Deviation: Flex Slots: 478; Regular Slots: 337; Total: 701 Avg. = Average (2/01/10 – 1/01/11)