Download
1 / 30
300 likes | 317 Views
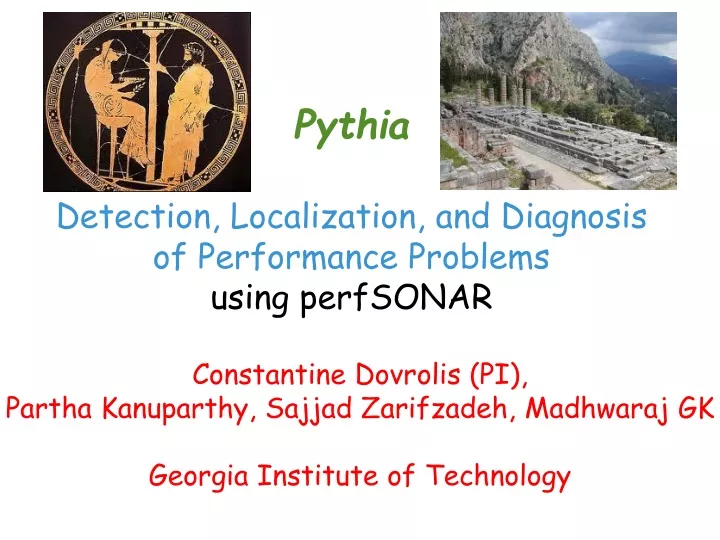
Pythia Detection, Localization, and Diagnosis of Performance Problems using perfSONAR. Constantine Dovrolis (PI), Partha Kanuparthy, Sajjad Zarifzadeh, Madhwaraj GK Georgia Institute of Technology. Basics. Pythia is a data-analysis tool, utilizing data collected through perfSONAR

E N D
PythiaDetection, Localization, and Diagnosis of Performance Problemsusing perfSONAR • Constantine Dovrolis (PI), • Partha Kanuparthy, Sajjad Zarifzadeh, Madhwaraj GK • Georgia Institute of Technology
Basics • Pythia is a data-analysis tool, utilizing data collected through perfSONAR • Our focus: performance problems • Objectives: detection, localization, diagnosis • Funded by DoE: started Sep/2011
One tool, three objectives • Detection “noticeable loss rate between ORNL and SLAC on 07/11/11 at 09:00:02 EDT” • Localization“it happened at DENV-SLAC link” • Diagnosis“it was due to insufficient router buffers”
Pythia – System architecture • Centralized process pulls data from perfSONAR MAs (OWAMP, traceroute, ..) OWAMP MA 3 traceroute MA Pythia server OWAMP MA 1 BWCTL MA ... MA OWAMP MA 2 Localization Preprocessing Detection Diagnosis
Detection “noticeable loss rate between ORNL and SLAC on 07/11/11 at 09:00:02 EDT”
Detection • Look for statistically significant deviations from baseline OWDs • But, baseline can change abruptly • Scalability requirement: only a single pass through OWAMP timeseries is allowed baseline Congestion: NY-CLEV
Detection (cont’) • Dynamic estimation of baseline OWD • Based on kernel density estimator in sliding window • Identify level-shifts (e.g., NTP clock shifts, routing changes) • All stat-significant deviations are considered potential perf-problems Congestion: NY-CLEV
Some detection results • Detection outputs congestion events • > 10s long • start, end timestamps • ESnet data: • 12 days, 33 monitors • Internet2 data: • 22 days, 9 monitors
How long are the observed congestion events? • ESnet, I2: 90% of events 10-20sec long • this is sufficient to affect app-performance • delay increases by 10s of milliseconds • Some events are common across paths ESnet Internet2
Are lossy events common? • ESnet: no lossy congestion events • Internet2: 6 of 2268 events are lossy < 0.1% loss rate as sampled by OWAMP Internet2
Localization “it happened at DENV-SLAC link”
Network tomography • Given N sensors, monitor N(N-1) directed paths in terms of OWD & L3-routing (traceroute) • Given path measurements {mi,j}, infer link measurements {xl}, so that the following path-metric constraints are satisfied
Prior work in net-tomography • Either analogue tomography, i.e., the link and path metrics are real numbers • Example: path delay = sum (link delays) • Very sensitive to measurement noise, requires long measurements • Or binary tomography, i.e., the link and path metrics are Boolean (Good vs Bad) • Example: path is Bad if at least one of its links is Bad (lossy) • More robust, but its outcome is of limited resolution
What happens in practice? • In practice, path measurements are always noisy, and they have to be short (due to non-stationarities) • So, two paths may go through the same bottleneck even if their path measurements are not exactly equal
Example Lossy paths: P(1,4): 15% P(2,4): 5% P(3,4): 7% • Boolean tomography would infer that link (4,5) is the only Lossy link (why?) • With a=0.5, paths P(2,4) & P(3,4) are a-similar • Then, a more plausible solution is that link (4,5) has loss rate [5%-7%], while link (1.4) has loss rate [8%-10%]
We propose: Range Tomography For each link l, estimate a range [sl,el].
We solved two instances of the range tomography problem • MIN function (e.g., avail-bw or capacity): • SUM function (e.g., queueing delay): • The loss rate metric can be approximated by SUM if link loss rates are small and independent
The location of bad links (Esnet) • ESnet: 9 congestion events • 1 bad link localized for each • up to 75 paths affected by an event: Bad link
The location of bad links (Internet2) • Internet2: 266 congestion events in 22 days • 3 bad links: 1 case • 2 bad links: 6 cases • 1 bad link: rest • Few bad links dominate 90% events: • ge-6-2-0.0.rtr.kans (58% events)ge-1-2-0.0.rtr.chic (25%)xe-1-1-0.0.rtr.hous (6%) Timeline of bad links: peaks around 7th March 2011
A case with two bad links at the same time • Internet2: event with two bad links • 28th Feb 2011, 00:10:51 GMT • Localized bad links:ge-6-2-0.0-rtr.KANS ge-6-1-0.0-rtr.LOSA • Predicted bad link performance (avg):26ms and 57ms path: CHIC to LOSA path: ATLA to KANS path:HOUS to LOSA
Diagnosis “it was due to insufficient router buffers”
Diagnosis: Approach • How can we go from set of observed symptoms to underlying root-cause? • Most existing network problem diagnosis systems take a machine learning approach, but that requires many training examples • Most existing diagnosis systems do not focus on network performance problems • Our focus: use model-based approach to associate each root-cause with an expected set of symptoms (signatures)
Which pathologies do we currently consider? • Various congestion types • Routing events and anomalies • Various loss-episode types • Reordering causes • Various end-host effects
Congestion types Overload: ESnet • “Overload”: persistent queue build-up • “Bursty traffic”: intermittent queues (high jitter) • Very small buffers • Excessive buffers Bursty: PlanetLab Excessive buffer: Home link Bursty: Home link
Loss nature • Random losses: observed losses do not have significant correlation with queueing delays of “nearby” packets • Otherwise: non-random losses Random losses: Home link Non-random loss: ESnet
End-host effects • Delays and losses induced due to: • context switches • clock synchronization (NTP) • OS virtualization (e.g., PlanetLab) PlanetLab: end-host noise Internet2: context switch
Input: Detected Events (delay, loss, reordering) Pythia Diagnosis Tree End-host effects Not shown: Unknown type NTP vs. route events Reordering nature Loss events Congestion
Diagnosis of ESnet events No buffer-based congestion events TBD: Reordering & routing/clock-syncs • About 700 paths • End-host events: 53% of total • Diagnosed network events: 1653
Pythia: Work in-progress • Diagnose more performance problems and improve existing tests • Unsupervised clustering to identify unknown events • Open-source system implementation: • Detection, localization, diagnosis • Real-time data collection framework: • ESnet, I2, PL-testbed, broadband networks • Create front-end for users/operators
Q&A • For any additional questions and for related papers, plz email me: constantine@gatech.edu