Download
1 / 13
140 likes | 255 Views
Explore allocation strategies to minimize costs and maximize efficiency in distributing goods from two plants to three markets through warehouses. Analyze different approaches to optimize supply chain logistics.

E N D
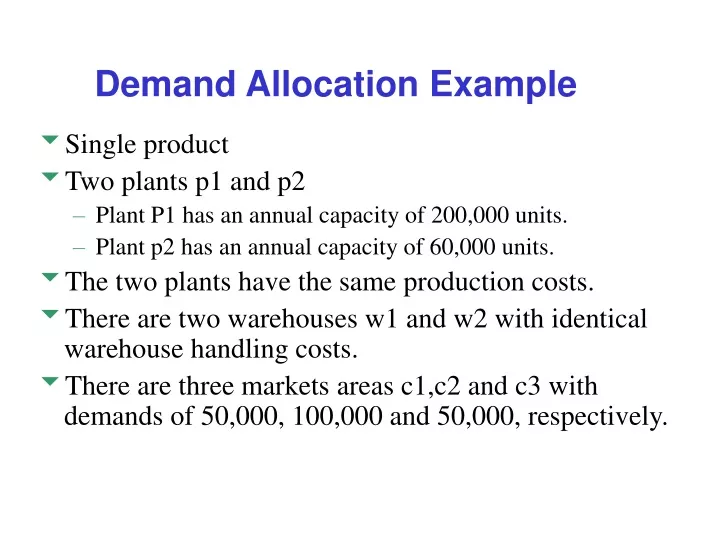
Demand Allocation Example • Single product • Two plants p1 and p2 • Plant P1 has an annual capacity of 200,000 units. • Plant p2 has an annual capacity of 60,000 units. • The two plants have the same production costs. • There are two warehouses w1 and w2 with identical warehouse handling costs. • There are three markets areas c1,c2 and c3 with demands of 50,000, 100,000 and 50,000, respectively.
Example: Distribution Network $0 D = 50,000 $3 Cap = 200,000 $4 $6 $5 D = 100,000 $2 $4 $1 $2 Cap = 60,000 $2 D = 50,000 Production costs are the same, warehousing costs are the same
Traditional Approach #1:Assign each market to closest WH. Then assign each plant based on cost. D = 50,000 Cap = 200,000 $5 x 140,000 D = 100,000 $2 x 50,000 $1 x 100,000 $2 x 60,000 Cap = 60,000 $2 x 50,000 D = 50,000 Total Costs = $1,120,000
Traditional Approach #2:Assign each market based on total landed cost $0 D = 50,000 $3 Cap = 200,000 P1 to WH1 $3 P1 to WH2 $7 P2 to WH1 $7 P2 to WH 2 $4 $4 $6 $5 D = 100,000 $2 P1 to WH1 $4 P1 to WH2 $6 P2 to WH1 $8 P2 to WH 2 $3 $4 $1 $2 Cap = 60,000 $2 D = 50,000 P1 to WH1 $6 P1 to WH2 $7 P2 to WH1 $10 P2 to WH 2 $4
Traditional Approach #2:Assign each market based on total landed cost $0 D = 50,000 $3 Cap = 200,000 P1 to WH1 $3 P1 to WH2 $7 P2 to WH1 $7 P2 to WH 2 $4 $4 $6 $5 D = 100,000 $2 P1 to WH1 $4 P1 to WH2 $6 P2 to WH1 $8 P2 to WH 2 $3 $4 $1 $2 Cap = 60,000 $2 D = 50,000 P1 to WH1 $6 P1 to WH2 $7 P2 to WH1 $10 P2 to WH 2 $4 Market #1 is served by WH1, Markets 2 and 3 are served by WH2
Traditional Approach #2:Assign each market based on total landed cost $0 x 50,000 D = 50,000 $3 x 50,000 Cap = 200,000 P1 to WH1 $3 P1 to WH2 $7 P2 to WH1 $7 P2 to WH 2 $4 $5 x 90,000 D = 100,000 P1 to WH1 $4 P1 to WH2 $6 P2 to WH1 $8 P2 to WH 2 $3 $1 x 100,000 $2 x 60,000 Cap = 60,000 $2 x 50,000 D = 50,000 P1 to WH1 $6 P1 to WH2 $7 P2 to WH1 $10 P2 to WH 2 $4 Total Cost = $920,000
Which market is served by which plant? Which supply sources are used by a plant? xij = Quantity shipped from plant site i to customer j Demand Allocation Model 5-10
The Optimal Strategy Table 2 Distribution strategy Facility P1 P2 C1 C2 C3 Warehouse W1 140000 0 50000 90000 0 W2 0 60000 0 10000 50000 The total cost for the optimal strategy is 740,000.
A real example:much more complex problem, the current Network Inbound: $ 851,000 Outbound: $ 2,930,000 Inv Cost: $13,291,000 WH Fixed: $ 1,875,000 Total: $18,947,000
A real example:Optimal Network Inbound: $ 783,000 Outbound: $ 5,900,000 Inv Cost: $ 7,679,000 WH Fixed: $ 625,000 Total: $14,987,000 $4 Million Savings