Download
1 / 10
100 likes | 356 Views
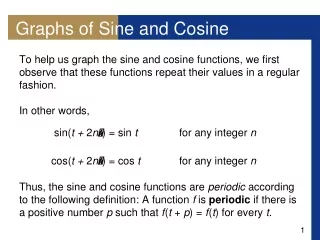
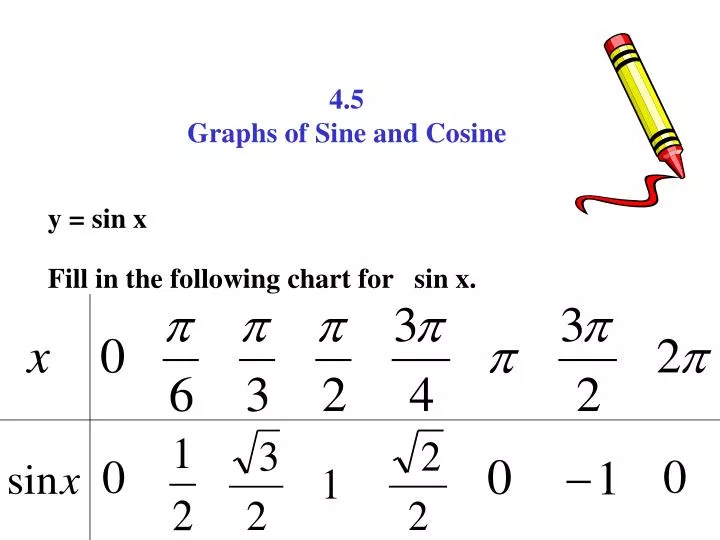
4.5 Graphs of Sine and Cosine. y = sin x. Fill in the following chart for sin x. y = sin x. y = - sin x. 1. -1. Range:. Period =. y = cos x. y = - cos x. 1. -1. Range:. Period =. The period, amplitude, vertical and horizontal phase shifts of sine and cosine.

E N D
4.5 Graphs of Sine and Cosine y = sin x Fill in the following chart for sin x.
y = sin x y = - sin x 1 -1 Range: Period =
y = cos x y = - cos x 1 -1 Range: Period =
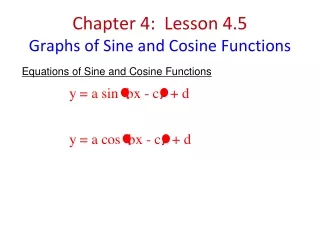
The period, amplitude, vertical and horizontal phase shifts of sine and cosine. v.s. = vertical shift (up and down) A = amplitude n = period (found by dividing 2 pi by n) h.s. = horizontal shift (left and right)
+ sin tick marks - sin tick marks + cos tick marks - cos tick marks
Find: v.s. = A = P = h.s. = up 1 y = 1 + 3 sin 2(x - ) 3 4 1 -2 x-axis This is a + sin, so tick off the + sin’s. Label the middle tick mark with the horz. shift. Add and subtract the period from the h.s.
Friday night at the fights. Melanie tastes pavement!
Find: v.s. = A = P = h.s. = -2 4 y = -2 – 4cos 3(x + ) 2 x-axis -2 -6 This is a - cos, so tick off the – cos’s. Label the middle tick mark with the horz. shift. Add and subtract the period from the h.s.
Find: v.s. = A = P = h.s. =
Coordinate Plane 1 -1