Download
1 / 17
170 likes | 187 Views
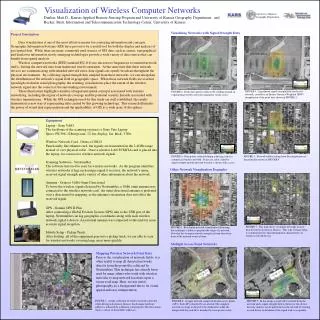
This study analyzes the effects of visualizing personal networks during qualitative interviews, focusing on biases, drawings vs visualizations, and visual variables. It explores associative and structural biases in recall accuracy, utilizing drawings and computer visualizations to compare social circles, locations, and structures. The research involved in-depth interviews with respondents in Barcelona, examining ethnic identities. Results showed similarities and differences between drawings and visualizations, with informants finding the visual representation accurate and identifying errors. Visual variables such as color and position enriched the understanding of alters, isolates, and clusters within the networks. The study suggests that personal network visualization enhances qualitative interviews by capturing social relationship dynamics and providing structural insights that would otherwise be missed.

E N D
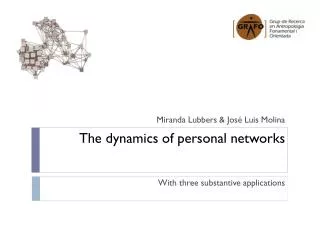
The Influence of Visualization of Personal Networks in Qualitative Interviews with Respondents Molina, J.L., McCarty, C., Aguilar, C., & Rota, L. III Seminario para el análisis de redes sociales & I International Workshop de la Red Hispana para el Análisis de Redes Sociales, Sevilla, 7, 8 y 9 de Septiembre 2005
Research Question … What we get when both respondents and interviewers are in front of a personal network visualization? Different,we mean …
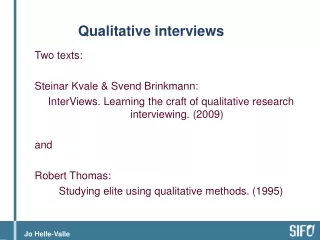
Bias, Drawings, Visual variables … • Egonet’ personal networks visualizations are based on cognitive reports from informants about their social world… we are interest in bias on recall people. • Drawings vs. Visualizations of the same personal networks. • Effects of visual variables in the qualitative interview.
Associative & Structural Bias …(i) • Associative bias (Brewer) is a well-known effect: people are recalled by perceived social proximity. This mean that the main factor on recall is the social context where people interact (family, work, College …). • Along with this factor there are others: far location of alters, personal characteristics, acoustic similarity of persons' names…
Associative & Structural Bias …(ii) • Structural bias … social connections are recalled under some effects: • Tertius gaudens (Burt, 1994). • Superior status (Festinger, Warner). • More interaction more relialibility reporting social ties(Romney & Faust, 1983). • More centrality in the social structure betther knlwedge of what is going on …(Krackhardt, 1990). • Fill-in-the-blanks, Freeman, 1992).
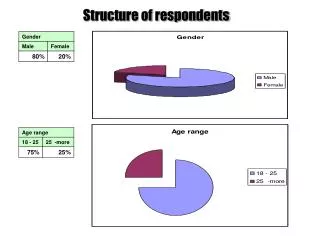
Research … • We performed 19 in depth interviews during the first trimester of 2005 in Barcelona (12 women and 7 men, 33 years old of mean). • The focus of interview was ethnic identity: 10 from Spain, 3 from Ghana, 2 from Serbia, 1 from Senegal, 1 from Croatia and 2 from Bosnia).
Drawings ex ante …(i) • Within the interview we got a drawing of each person about his/her personal network with those instructions: • “We would like you to draw your social circles. The more people in each circle, the larger it will be. Circles that are farther apart mean that they are less socially connected. Circles can also overlap. You can also specify single individuals. When you are done drawing, you can put a label or name in each circle to tell us what it is.”
Computer visualization ex post • Some days after we got a visualization of the same personal network with the aid of Egonet and a free list of 45 people and 990 pair tie evaluations: • “Please, tell us a list of 45 people you know on a personal basis (first name and viceversa), that both of you met at least once within the last two years and that you could contact him/her if necessary. Also, try that all types of contacts be represented”.
Drawings vs visualizations …(i) Same social circles … perceived social proximity
Drawings vs visualizations …(ii) Same social circles but different person in the center
Drawings vs visualizations …(iii) Same social circles … with far location …
Drawings vs visualizations …(iv) Different structure
Drawings vs visualizations … summary • Similarities: social circles are almost de same in all cases. • Differences: • Structure • Isolates (free list effect) • Overlapping (Egonet 1rst version limitation)
Qualitative interviews & Personal Network visualization • The informants believe that the graph representing their personal network is an accurate representation of it. because it captures the way social relationships are memorized 2. Informants like the visualization very much because it is based on their reports and talk about them. 3. Informants detect errors either in the nodes or in the connections because their fault.
Qualitative interviews & Personal Network visualization 4. Visual variable: color. The gradation of color represented betweeness. enacted new information about the alter and the vital history of ego. 5. Visual variable: position. Isolates. enacted new information about separate spheres of activity of ego. 6. Visuals variables: linking and position. Clusters of people. enacted new information about the way groups are related.
Q & PN visualization • Is it possible to perform an in-depth interview without the aid of the personal network visualization? ;-)
Q & PN visualization (ii) • Combining three o four visual variables at the same time we get structural information about the social world of the informant that we cannot get for other ways