1 / 58

200 pt

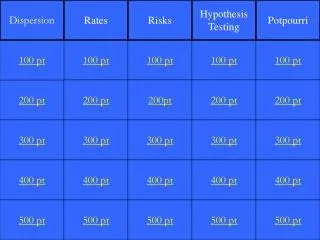
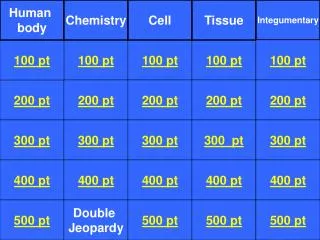
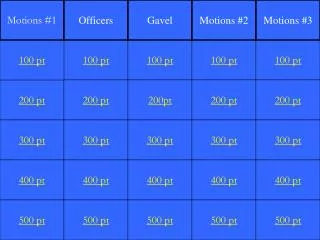
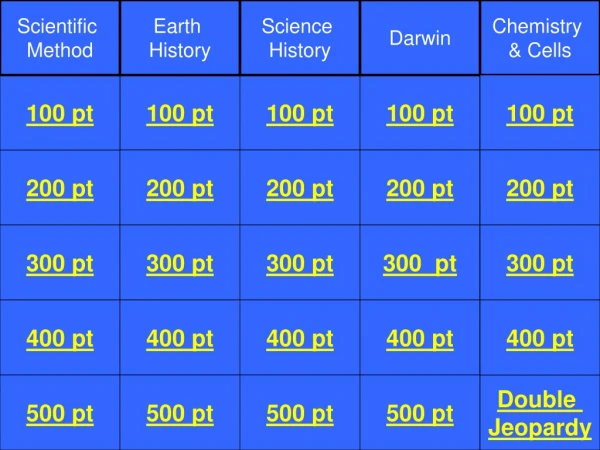
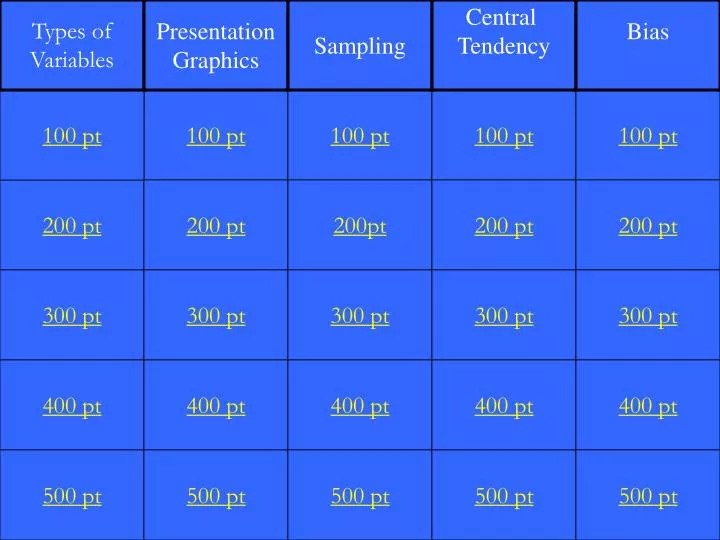
Types of Variables. Presentation Graphics. Sampling. Central Tendency. Bias. 100 pt. 100 pt. 100 pt. 100 pt. 100 pt. 200 pt. 200 pt. 200pt. 200 pt. 200 pt. 300 pt. 300 pt. 300 pt. 300 pt. 300 pt. 400 pt. 400 pt. 400 pt. 400 pt. 400 pt. 500 pt. 500 pt. 500 pt. 500 pt.

edric
Download Presentation

200 pt

An Image/Link below is provided (as is) to download presentation Download Policy: Content on the Website is provided to you AS IS for your information and personal use and may not be sold / licensed / shared on other websites without getting consent from its author. Content is provided to you AS IS for your information and personal use only. Download presentation by click this link. While downloading, if for some reason you are not able to download a presentation, the publisher may have deleted the file from their server. During download, if you can't get a presentation, the file might be deleted by the publisher.

E N D

Presentation Transcript


  1. Types of Variables Presentation Graphics Sampling Central Tendency Bias 100 pt 100 pt 100 pt 100 pt 100 pt 200 pt 200 pt 200pt 200 pt 200 pt 300 pt 300 pt 300 pt 300 pt 300 pt 400 pt 400 pt 400 pt 400 pt 400 pt 500 pt 500 pt 500 pt 500 pt 500 pt

  2. The height, in inches, of incoming third graders.

  3. What is a continuous variable?

  4. Gender.

  5. What is a categorical variable?

  6. Blood type.

  7. What is a categorical variable?

  8. Potassium levels in blood samples.

  9. What is a continuous variable?

  10. Race, ethnicity, or national origin.

  11. What is a categorical variable?

  12. The numbers appear here.

  13. What is the stub?

  14. Column headings.

  15. What is the boxhead?

  16. The reference the data was taken from.

  17. What is the source area?

  18. Column totals and summaries.

  19. What is the stub?

  20. Description of time, place and subjects of research.

  21. What is the title?

  22. The group of people research is to learn about.

  23. What is the population?

  24. Some portion of the population being observed.

  25. What is a sample?

  26. A group which accurately represents the population being studied.

  27. What is a valid sample?

  28. A number which is not influenced by any factors of a study.

  29. What is a random number?

  30. An individual from whom measurements are taken for study.

  31. What is a subject?

  32. One number charactering of an entire data set.

  33. What are measures of central tendency?

  34. The most frequently observed measurement.

  35. What is the mode?

  36. The middle rank of an ordered data set.

  37. What is the median?

  38. The measure of central tendency most influenced by extreme values.

  39. What is the mean?

  40. Calculated by the formula: (n+1) ÷2

  41. What is the middle rank?

  42. Subjects can exclude themselves for religious reasons.

  43. What is selection bias?

  44. Symptoms observed are caused by some disease not being studied.

  45. What is confounding?

  46. The laboratory test results give false positives.

  47. What is information bias?

  48. Subjects are chosen randomly from among volunteers.

  49. What is selection bias?

  50. Subjects knowing they are being observed always follow safety procedures.

More Related