Download
1 / 5
50 likes | 136 Views
1-68M 1-6M X-29M. 1-42M 1-9M NO MAR. a. b. 25. 20. 15. % GFP-expressing cells. 10. 5. 0. Ctr. No MAR. 1-68M. 1-6M. X-29M. 1-9M. 1-42M.

E N D
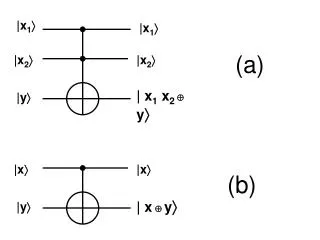
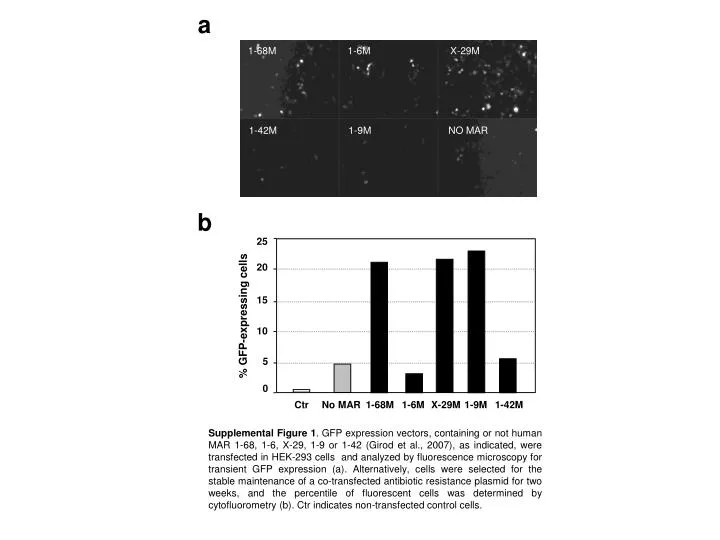
1-68M 1-6M X-29M 1-42M 1-9M NO MAR a b 25 20 15 % GFP-expressing cells 10 5 0 Ctr No MAR 1-68M 1-6M X-29M 1-9M 1-42M Supplemental Figure 1. GFP expression vectors, containing or not human MAR 1-68, 1-6, X-29, 1-9 or 1-42 (Girod et al., 2007), as indicated, were transfected in HEK-293 cells and analyzed by fluorescence microscopy for transient GFP expression (a). Alternatively, cells were selected for the stable maintenance of a co-transfected antibiotic resistance plasmid for two weeks, and the percentile of fluorescent cells was determined by cytofluorometry (b). Ctr indicates non-transfected control cells.
0 1 2 3 4 5 6 7 a b 128 100 1-68M Retro 1-6M Retro 80 X-29M Retro Retro ** Ctr Cell counts 60 % Expressing cells * 40 20 0 0 100 101 102 103 104 GFP fluorescence Ctr Retro X-29M Retro 1-68M Retro 1-6M Retro Ctr Retro X-29M Retro 1-6M Retro 1-68M Retro c d 100 1-68M ** 80 Retro 1-6M 60 ** *** Retro Intensity of fluorescence *** 40 Retro 20 Ctr 0 Infectious particle / ml (x10-4) Supplemental Figure 2. MAR-driven transgene expression and retroviral vector production from amphotropic packaging cells. An amphotropic HEK-293-derived cell lines was used in transient transfections of the MAR-Retro-GFP and pRetro-GFP, containing or not the X-29, 1-6 or 1-68 human MAR elements, as indicated. (a) Cytofluorometry profiles were determined 48h after transfection and compared to that of untransfected cells (filled profile, panel a). The percentile of GFP expressing cells and the levels of GFP fluorescence are shown in panel b and c. The titers of viral vector in the culture supernatant are shown in panel d.
0 2 4 6 8 10 a b 1.6 1-68M * Retro 1.2 1-6M * SEAP (mg/ml) 0.8 Retro 0.4 Retro 0 0 0.1 0.2 0.3 0.4 Retro Retro 1-6M Retro 1-6M Retro 1-68M Retro 1-68M Retro Normalized viral vector RNA c d 1.6 * 1-68 M * Retro 1.2 1-6 M SEAP (mg/ml) 0.8 Retro 0.4 Retro 0 Normalized viral vector RNA Supplemental Figure 3. Expression analysis and viral RNA levels of SEAP from stably and transiently transfected amphotropic cells. HEK-293 cells were stably and transiently transfected with vectors MAR-Retro-SEAP and pRetro-SEAP which contain or not the human MAR elements (1-6M and 1-68M). SEAP expression levels were analyzed 48h after transfection (panel a). The viral RNA levels of the same cells are shown in panel b. SEAP expression and viral RNA from producer cells were analyzed after stable transfections (panel c and d respectively).
a 128 1-68M Retro 1-6M Retro Retro Cell counts S1 S2 0 100 101 102 103 104 b GFP fluorescence ** 1-68M Retro ** 1-6M Retro Retro Subpop. 1 Ctr Subpop. 2 0 2 4 6 8 10 12 14 16 18 20 Infectious particle / ml (x10-4) Supplemental Figure 4. Analysis of viral particle titers of polyclonal populations displaying high or low GFP expression. Two subpopulations which express low (S1) or high (S2) levels of GFP were sorted by cytofluorometry from stable polyclonal populations generated with or without MAR (Fig. 3). Viral titers were determined from culture supernatants by transducing 208F cells and by quantitating GFP-expressing cells (panel b).
Suppl. Table 1. MAR elements increase retroviral vector production from HEK-293 packaging cells. * Supplemental Table 1. Six randomly selected RV vector-producing HEK-293 cell clones were characterized in terms of the number of plasmid copies stably integrated in their genome, GFP expression (relative light units), the coefficient of variability of GFP fluorescence between cells of the same clone, and the viral titer in the crude culture supernatant (infectious viral particles per ml). * indicates p = 0.01 when compared to the values of the clones generated without a MAR by Student t-test.