Download
1 / 50
510 likes | 770 Views
Chapter 12 Business Cycles and Unemployment. Lecture Slides. Survey of Economics Irvin B. Tucker. 1. This chapter will answer these questions:. How are cycles measured? What causes business cycles? What is unemployment? . What is a business cycle?.

E N D
Chapter 12Business Cycles and Unemployment Lecture Slides Survey of EconomicsIrvin B. Tucker 1
This chapter will answer these questions: How are cycles measured? What causes business cycles? What is unemployment?
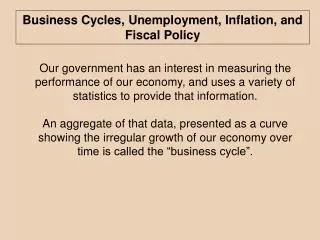
What is abusiness cycle? Alternating periods of economic growth and contraction, which can be measured by changes in real GDP
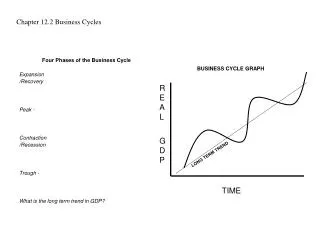
What are the four phases of a business cycle? Peak Recession Trough Expansion
What is a peak? The phase of the business cycle during which real GDP reaches its maximum after rising during a recovery
What is a recession? A downturn in the business cycle during which real GDP declines, and the unemployment rate rises. Also called a contraction.
How long before a downturn is a recession? As a general rule, at least two consecutive quarters in which real GDP declines
When is a downturn considered a depression? The term depression is primarily an historical reference to the extremely deep and long recession of the early 1930’s
What is a trough? The phase of the business cycle in which real GDP reaches its minimum after falling during a recession
What is a recovery? An upturn in the business cycle during which real GDP rises. Also called an expansion.
Exhibit 12.1(a) Hypothetical Business Cycle Peak Growth trend line Real GDP per year Peak Trough Recession Expansion One business cycle 11 Year
Exhibit (b) Actual Business Cycle Peak 13.5 13.0 12.5 Trillions of 2005 dollars 12.0 Peak 11.5 11.0 Trough 10.5 Expansion Recession 10.0 2000 2001 2002 2003 2004 2005 2006 2007 One Business Cycle Year 12
Exhibit 12.2 Severity of Post-World War II Recessions Peak Unemployment Rate Percentage Decline in Real GDP Recession Dates Duration (months) Nov. 1948 - Oct. 1949 11 -1.7% 7.9% July 1953 - May 1954 10 -2.7 5.9 Aug.1957 – Apr. 1958 8 -1.2 7.4 Apr. 1960 – Feb. 1961 10 -1.6 6.9 Dec. 1969 – Nov. 1970 11 -0.6 5.9 Nov. 1973 - Mar. 1975 16 -3.1 8.6 Jan. 1980 – July 1980 6 -2.2 7.8 July 1981 - Nov. 1982 16 -2.9 10.8 July 1990 –Mar. 1991 8 -1.3 6.8 Mar. 2001 - Nov. 2001 8 -0.3 5.6 Dec. 2007- June 2009 18 -4.1 9.7 Average 11 -2.0 7.6
What iseconomic growth? An expansion in national output measured by the annual percentage increase in a nation’s real GDP 14
Why is growth an economic goal? It increases our standard of living - it creates a bigger “economic pie”
Exhibit 12.3 A Historical Record of Business Cycles in the United States, 1929-2010 20 Annual real GDP growth 15 Long-term average growth 10 5 Annual Real GDP Growth Rate (percent) 3.5 0 Zero growth -5 -10 -15 `29 `30 `35 `40 `45 `50 `55 `60 `65 `70 `75 `80 `85 `90 `95 `00 `05 `10 Year 16
Exhibit 12.4 An International Comparison of GDP Growth Rates, 2010 10.3% 10.3% Real GDP growth rates (percent) 5.5% 4.0% 3.9% 3.5% 2.9% 1.5% 1.2% China India Mexico United Kingdom Japan United States France Russia Germany Country 17
What are the three types of economic indicators? Leading Coincident Lagging
What is aleading indicator? Variables that change before real GDP changes
Exhibit 12.5 Leading Indicators • Average workweek • Unemployment claims • New consumer goods orders • Delayed deliveries • New orders for plant and equipment • New building permits • Stock prices • Money supply • Interest rates • Consumer expectations
What is acoincident indicator? Variables that change at the same time that real GDP changes
Exhibit 12.5 Coincident Indicators • Nonagricultural payrolls • Personal income minus transfer payments • Industrial production • Manufacturing and trade sales
What is alagging indicator? Variables that change after real GDP changes
Exhibit 12.5 Lagging Indicators • Unemployment rate • Duration of unemployment • Labor cost per unit of output • Consumer price index for services • Commercial and industrial loans • Commercial credit to personal income ratio • Prime interest rate
What is the unemployment rate? The percentage of people in the civilian labor force who are without jobs and are actively seeking jobs
How is the unemployment rate calculated? Each month, the Bureau of Labor Statistics (BLS) surveys 60,000 households at random
What is thecivilian labor force? People 16 years or older who are either employed or actively seeking a job, excluding members of the armed forces, homemakers, and people in institutions
Who is considered employed? Anyone who works at least one hour a week for pay or at least 15 hours per week as an unpaid worker in a family business
Who is considered unemployed? Anyone who is 16 years of age and above who is actively seeking employment
Who is adiscouraged worker? A person who wants to work, but who has given up searching for work
Total Population age 16 and over Exhibit 12.6 Civilian labor force Not in Labor ForceArmed forcesHousehold workersStudentsRetireesPersons with disabilitiesInstitutionalized personsDiscouraged workers EmployedEmployeesSelf-employed UnemployedNew entrantsRe-entrantsLost last jobQuit last jobLaid off
Unemployment rate unemployed civilian labor force X 100 =
Exhibit 12.6 Population, Employment, and Unemployment, 2010 Number of Persons (millions) Total civilian population age 16 and over 237.8 Not in labor force -83.9 Civilian force 153.9 Employed 139.1 Unemployed 14.8 Civilian unemployment rate 9.6% 33
Exhibit 12.7 The U.S. Unemployment Rate, 1929-2010 25 20 U.S. Unemployment Rate (percent) 15 10 5 0 1930 1940 1950 1960 1970 1980 1990 2000 2010 Year 34
Exhibit 12.8 Unemployment Rates for Selected Nations, 2010 24.8% Unemploy-ment rates (percent) 12.5% 9.7% 9.6% 8.0% 7.8% 6.8% 5.1% 4.1% United States Canada South Africa France United Kingdom Greece Japan China Germany Country
What are criticisms of the unemployment rate? Does not include discouraged workers Includes part-time workers Not measure underemployment
What is underemployment? People working at jobs below their level of skills
What are the types of unemployment? Frictional Structural Cyclical
What is frictional unemployment? Normal search time required by workers with marketable skills who are changing jobs, entering, or re-entering the labor force, or seasonally unemployed
What is structural unemployment? A mismatch of the skills of workers out of work and the skills required for existing job opportunities
What is the difference between outsourcing and offshoring? Outsourcing is the practice of a company having its work done by another company in another country. • Offshoring occurs when a U.S. companyhires employees from another country to perform jobs once done by the company’s American employees. 41
What is cyclical unemployment? Unemployment caused by the lack of jobs during a recession
What isfull employment? When an economy operates at an unemployment rate equal to the sum of frictional and structural unemployment rates. Also called the natural rate of unemployment.
What rate is considered full employment? The natural rate of unemployment changes over time, but today it is considered to be about 5 percent
What is the GDP gap? The difference between actual real and full-employment real GDP GDP = actual real GDP – potential real GDP
What is the cost of cyclical unemployment? The GDP gap
Exhibit 12.9 Actual and Potential GDP, 1997-2010 14,000 GDP GAP (positive) 13,500 13,000 12,500 GDP GAP (negative) Actualreal GDP Billions of 2005 dollars 12000 11,500 11,000 10,500 Potential real GDP 10,000 9,500 `97 `98 `99 `00 `01 `02 `03 `04 `05 `06 `07 `08 `09 `10 Year 47
Conclusion? The gap between actual and potential real GDP measures the monetary losses of real goods and services when at less than full employment
Exhibit 12.10 Civilian Unemployment Rates by Selected Demographic Groups, 2010 Unemployment Rate (percent) Demographic Group Overall 9.6% Sex Male 10.5 Female 8.6 Race White 8.7 Hispanics 12.5 African American 16.0 Teenagers (16-19 years old) All 25.9 White 23.2 Hispanics 32.2 African American 43.05 Education Less than high school diploma 14.9 High school graduates 10.3 Bachelor’s degree or higher 4.7 48
END 50