Download
1 / 34
340 likes | 552 Views
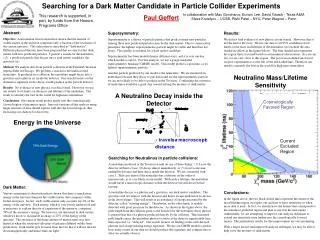
Paul Geffert , Max Goncharov, Eunsin Lee, and David Toback - Texas A&M Slava Krutelyov – UCSB Rishi Patel – NYU Peter Wagner – Penn.

E N D
Paul Geffert, Max Goncharov, Eunsin Lee, and David Toback - Texas A&M Slava Krutelyov – UCSB Rishi Patel – NYU Peter Wagner – Penn Updated Figures for:Search for Heavy, Long-Lived Neutralinos in Gauge Mediated Supersymmetry Breaking Models Using Photon Timing at CDF II(to be submitted to PRD) Paul Geffert -Texas A&M University
Purpose • Delayed Photon Analysis published in PRL • PRL 99, 121801 (2007) • Want to publish more details in a full PRD • Iterating draft with Godparents: F. Bedeschi, H. Budd, A. Messina • Today: Current versions of figures updated since CDF notes were posted • No New Results • Will eventually re-bless Paul Geffert -Texas A&M University December 19, 2007 SUSY Meeting 2
Outline • Short Overview of the Motivation and Theory • Brief Summary of the Analysis • Plots • Conclusion Supporting Documentation: CDF Notes 7515, 7918, 7928, 7929, 7960, 8015, 8016 Paul Geffert -Texas A&M University December 19, 2007 SUSY Meeting 3
Motivation and Theory • GMSB models predict heavy neutralinos that decay to photons (see next slide) • candidate event at CDF in Run I • First search for heavy, long-lived particles that decay to photons at a hadron collider Paul Geffert -Texas A&M University December 19, 2007 SUSY Meeting 4
GMSB Models • The lightest neutralino is the NLSP and decays into a gravitino and a photon • For much of the parameter space the neutralino decay time can be ~ns • At the Tevatron neutralinos are pair produced from Paul Geffert -Texas A&M University December 19, 2007 SUSY Meeting 5
Brief Summary of the Analysis Leave the detector Signature Can be identified • analysis is sensitive to ns lifetimes while analysis is sensitive to prompt neutralino decays Toback and Wagner, PRD 70, 114032 (2004) Paul Geffert -Texas A&M University December 19, 2007 SUSY Meeting 6
Next Tell the story of the analysis using the PRD figures… Paul Geffert -Texas A&M University December 19, 2007 SUSY Meeting 7
PRD Figure 1- Feynman Diagrams Feynman diagrams of the dominant production processes at the Tevatron Use SPS 8 GMSB model line (Eur. Phys. J. C 25, 113 (2002)): tan(β)=15, sgn(μ)=1, Nm=1, and Mm=2 Paul Geffert -Texas A&M University December 19, 2007 SUSY Meeting 8
PRD Figure 2- Event Schematic and Time Distribution Left- Schematics of a long-lived neutralino decay into a gravitino and a photon Right- The corrected time distribution for a GMSB example point as well as the non-collision and SM backgrounds Paul Geffert -Texas A&M University December 19, 2007 SUSY Meeting 9
Fig. 3- Photon Can Hit the Calorimeter with a Large Incident Angle Left- Definition of a, the projection of the photon incident angle in the (r,z) plane Right- Definition of b, the projection of the photon incident angle in the (r, f) plane Paul Geffert -Texas A&M University December 19, 2007 SUSY Meeting 10
Fig. 4- Look at Photon Incident Angles Delayed photons have a larger incident angle than promptly produced photons Distribution of the total incident angle, y, of the photon at the face of the calorimeter Paul Geffert -Texas A&M University December 19, 2007 SUSY Meeting 11
Fig. 5- Compare ID Variables (Long Lifetime vs. 0 Lifetime) CDFSim ID variable distributions minus their requirement value Paul Geffert -Texas A&M University December 19, 2007 SUSY Meeting 12
Fig. 6- Efficiency vs. Angle, Compare Electrons and Photons from Data and MC • Left- The efficiencies for e’s and g’s to pass ID requirements vs. incident angle a • Right- The same but for b • Efficiency falls in b primarily due to the energy isolation requirement; small effect, well-modeled in MC Paul Geffert -Texas A&M University December 19, 2007 SUSY Meeting 13
Fig. 7- New PMT Asymmetry Cut to Kill Spikes Compare asymmetry of spikes to real electrons Require asymmetry to be less than 0.6 Paul Geffert -Texas A&M University December 19, 2007 SUSY Meeting 14
Fig. 8- Vertexing The collision time and position for the reconstructed highest SpT vertex in Wen events Also show correlation for fun Paul Geffert -Texas A&M University December 19, 2007 SUSY Meeting 15
Fig. 9- Vertexing Performance/ Resolution The difference in z and t between two arbitrarily selected sets of tracks from the same reconstructed vertex in a Wen dataset Paul Geffert -Texas A&M University December 19, 2007 SUSY Meeting 16
Fig. 10- Vertexing Performance continued; Compare Vertex to Electron Track The distributions are centered at zero no clustering bias The second Gaussian contains events where the electron is from a second vertex in the event Paul Geffert -Texas A&M University December 19, 2007 SUSY Meeting 17
Fig. 11- Vertexing Efficiency We require a vertex to have at least 4 tracks and SpT > 15 GeV 100% efficiency Paul Geffert -Texas A&M University December 19, 2007 SUSY Meeting 18
Fig. 12- Check EMTiming Simulation and Show Resolution Well centered around 0 ns with RMS of 0.64 ns Paul Geffert -Texas A&M University December 19, 2007 SUSY Meeting 19
Fig. 13- Timing Distribution for “Right” and “Wrong” Vertex Selection Top Left- Electron track matches vertex (“Right Vertex”) Top Right- Electron anti-matched to vertex (“Wrong Vertex”) Paul Geffert -Texas A&M University December 19, 2007 SUSY Meeting 20
Fig. 14- Systematic Variation of Timing Mean and RMS Look at the timing distribution for electrons from subsamples of Wen + jets events for different requirements on electron ET, jet ET, and Paul Geffert -Texas A&M University December 19, 2007 SUSY Meeting 21
Fig. 15- Systematic Variation of Timing – Wrong Vertex The mean and RMS of the timing for electrons as a function of h, when the wrong vertex is picked Paul Geffert -Texas A&M University December 19, 2007 SUSY Meeting 22
Fig. 16- Beam Halo Illustration of a beam halo event The mean corrected time changes as a function of h but is always less than zero Paul Geffert -Texas A&M University December 19, 2007 SUSY Meeting 23
Fig. 17- Beam Halo vs. Cosmics The variables used to separate cosmic and beam halo backgrounds to create their timing templates Paul Geffert -Texas A&M University December 19, 2007 SUSY Meeting 24
Fig. 18- Timing for Beam Halo and Cosmics The corrected time distributions for beam halo (left) and cosmic ray (right) backgrounds Paul Geffert -Texas A&M University December 19, 2007 SUSY Meeting 25
Fig. 19- More on Beam Halo Most beam halo photons arrive at f0 Use this for background normalization Paul Geffert -Texas A&M University December 19, 2007 SUSY Meeting 26
Fig. 20- Analysis Optimization The expected 95% C.L. cross section limit as a function of the lower value of the timing requirement for a GMSB example point Paul Geffert -Texas A&M University December 19, 2007 SUSY Meeting 27
Fig. 21- The Data…Timing Distribution Left- The timing distribution for the signal and all backgrounds Right- A zoomed in view of the signal region, [2,10] ns Two events are observed in the signal region, consistent with the background expectation of 1.3±0.7 events Paul Geffert -Texas A&M University December 19, 2007 SUSY Meeting 28
Fig. 22- Kinematic Distributions Compare background predictions and data No evidence for new physics Paul Geffert -Texas A&M University December 19, 2007 SUSY Meeting 29
Fig. 23- Expected and Observed Limits and Production Cross Sections Limits vs. lifetime for m=100 GeV Limits vs. mass for a lifetime of 5 ns Paul Geffert -Texas A&M University December 19, 2007 SUSY Meeting 30
Fig. 24- Results… The contours of constant 95% C.L. cross section upper limit for the observed number of events Paul Geffert -Texas A&M University December 19, 2007 SUSY Meeting 31
Fig. 25- Exclusion Region Expected and observed 95% C.L. exclusion region along with LEP limits Highest mass reach is 108 GeV (expected) and 101 GeV (observed) for a lifetime of 5 ns. Paul Geffert -Texas A&M University December 19, 2007 SUSY Meeting 32
Fig. 26- Expected Sensitivity for 2 fb-1 and 10 fb-1 Background scaled with luminosity The shaded band shows the cosmologically favored parameter space Paul Geffert -Texas A&M University December 19, 2007 SUSY Meeting 33
Conclusion • PRD in progress • Strong draft of figures • First reading of the PRD early January • Re-bless figures after second reading Paul Geffert -Texas A&M University December 19, 2007 SUSY Meeting 34