Download
1 / 82
820 likes | 1.02k Views
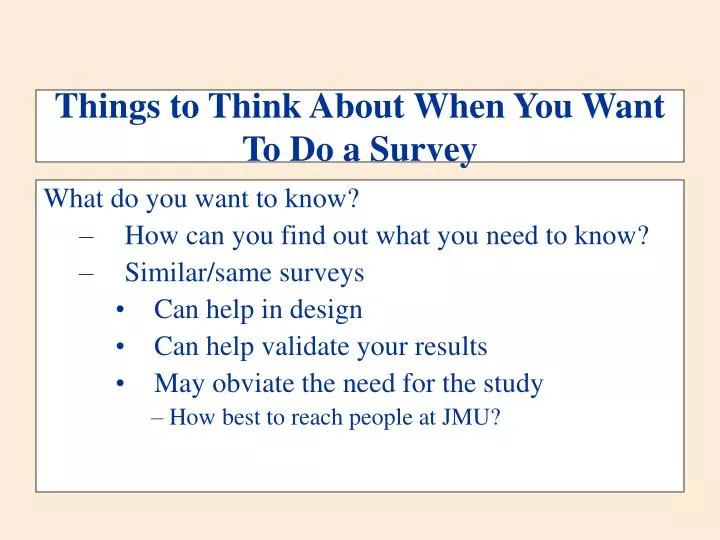
Things to Think About When You Want To Do a Survey. What do you want to know? How can you find out what you need to know? Similar/same surveys Can help in design Can help validate your results May obviate the need for the study How best to reach people at JMU?.

E N D
Things to Think About When You Want To Do a Survey What do you want to know? How can you find out what you need to know? Similar/same surveys Can help in design Can help validate your results May obviate the need for the study How best to reach people at JMU?
Things to Think About When You Want To Do a Survey Constraints Money/time Sample vs. population Mailing/Bulk Email
Things NOT to do Too Long (dining survey) Sensitive Questions Near the Front Double-barreled questions Measure more than one item at the same time Confounds responses and interpretation. Ceiling and floor effects
Things NOT to do Indeterminate Time (alumni survey question on volunteerism) Response sets not matched to question or question type. Bias Blatant Subtle
Things NOT to do “Don’t knows,” and “Neutrals,” and “no opinions” that allow “weaseling out” - Lack of “Don’t knows,” and “Neutrals,” and “no opinions” where they could have important meaning. - Ceiling and floor effects in responses
Examples and Discussion Study of Coffee Flavors on Visitors to a Coffee Shop 8 am 272 Questions
Examples and Discussion Study of potential clients for new clothing line beginning with questions about measurements and interests in “stretchable fabrics”
Examples and Discussion Do you believe that HOV lanes help reduce congestion and can help reduce pollution? Yes No
Examples and Discussion Do you plan on voting for the independent candidate? Yes No
Examples and Discussion How often do you use a pencil? 7 times 6 times 5times 4 times 3 times 2 times 1 time
Examples and Discussion How often do you attend soccer games? Very true Partly true Not true False Entirely False
Examples and Discussion Most smart people agree that the HOV lane is vital to reducing congestion. What do you think? I agree I disagree
Examples and Discussion Hybrid vehicles use less gasoline, make less noise, reduce owner costs. Please check which of the following hybrid programs you support. Tax incentives for owners Special HOV permisssions during peak hours None
Examples and Discussion Was your meal as good as you expected? Yes No Don’t know Alumni survey question about diversity in workplace.
Examples and Discussion How do you feel about euthanasia? Support Neutral Oppose Don’t know
Examples and Discussion Was the NATO embargo of Iraq in the 1990s effective? Yes No Don’t know
Examples and Discussion Please rate your dining experience. Excellent Terrible
Examples and Discussion Develop response categories that are mutually exclusive Problem: From which one of these sources did you first learn about the tornado in Derby? Radio TV Someone at work While at home While traveling to work
Examples and Discussion During this most recent ride, would you say that your seatbelt was fastened… All the time, that is, every minute the car was moving Almost all the time Most of the time About half the time Less than half the time Not all during the time the vehicle was moving
Examples and Discussion Use cognitive design techniques to improve recall Problem: We would like to ask about the most recent time you drove or rode anywhere in an automobile or other vehicle such as a pickup or van. During this most recent ride, would you say that your seatbelt was fastened… All the time Almost all the time Most of the time About half the time Less than half the time Not at all
Basic Question-Response Formats • Open-ended • Close-ended • Scaled-response
Basic Question-Response Formats Open-Ended Unprobed • Open-ended question:presents no response options to the respondent • Unprobed format:seeks no additional information • Advantages: • Respondent frame of reference; allows respondent to use his or her own words • Disadvantages: • Difficult to code and interpret • Respondents may not give complete answers
Basic Question-Response Formats Open-Ended Probed • Open-ended question:presents no response options to the respondent • Probed format:includes a response probe instructing the interviewer to ask for additional information or answer clarification • Advantages: • Elicits more-complete answers • Respondent frame of reference • Disadvantages: • Difficult to code, analyze, and interpret
Basic Question-Response Formats Close-Ended Dichotomous • Close-ended question: provides a set of answers from amongst which the respondent must choose • Dichotomous:has only two response options, such as “yes” - “no”; “have” – “have not”; “male” – “female” • Advantages: • Simple to administer, code, analyze • Disadvantages: • May oversimplify response options • May be in researcher frame of reference
Basic Question-Response Formats Close-Ended Multiple Category • Close-ended question: provides a set of answers from amongst which the respondent must choose • Multiple response:has more than two answer choices; must have “mutually exclusive” and “collectively exhaustive” answer set • Advantages: • Allows for broad range of possible responses • Simple to administer, code, and analyze • Disadvantages: • May be in researcher frame of reference • May not have all appropriate respondent answer options
Basic Question-Response Formats Scaled-Response Unlabeled • Scaled-response question: uses a scale (parts:a statement, instructions, a response format) to measure respondent feeling, judgment, perception … • Unlabeled:uses a scale that may be purely numerical (no words/phrases) or only the endpoints of the scale are identified • Advantages: • Allows for degree of intensity to be expressed without researcher options • Simple to administer, code, and analyze • Disadvantage: • Scale may not reflect respondents’ view
Basic Question-Response Formats Scaled-Response Labeled • Scaled-response question: uses a scale (parts: a statement, instructions, a response format) to measure respondent feeling, judgment, perception … • Labeled:a scale where all choices/positions are identified with some descriptive word/phrase • Advantages: • Allows for degree of intensity to be more clearly expressed • Simple to administer, code, and analyze • More consistency in responses • Disadvantage: • Scale choices more limited or too detailed
Considerations in Choosing a Question-Response Format • The nature of the property being measured • Gender=dichotomous; liking for chocolate=scale • Previous research studies • Use format of previous study if comparing • The data collection mode • Cannot use some scales on the phone • The ability of the respondent • Kids can only relate to certain types of visual scales • The level of analysis points to scale type needed
Basic Concepts in Measurement • Measurement: determining how much of a property is possessed; numbers or labels are then assigned to reflect the measure • Properties: specific features or characteristics of objects, persons, or events that can be used to distinguish them from others • Objective properties are physically observable or verifiable • Subjective properties are • mental constructs
Nominal data: The use of a descriptor, name, or label, to stand for each “unit” on the scale: “yes” “no”, “male” “female”,etc. Ordinal data: Objects, persons, events are placed in rank order on some characteristic in a specific direction. Zero and distance have no meaning; rank 1, 2, 3, etc. Interval data: Units of distance have meaning. There is an arbitrary zero point. Examples are temperatures in degrees Fahrenheit or Celsius; map distance Chicago to ? Ratio data:Multiples have meaning. There is an absolute or natural zero point. Examples: the Kelvin temperature scale, sales/costs in $, market share in % Scale Characteristics Determine the Level of Measurement (Level of Data)
Scale Nominal Numbers Assigned to Runners OrdinalRank Order of Winners IntervalPerformance Rating on a 0 to 10 Scale RatioTime to Finish, in Seconds Finish 7 8 3 Finish Third place Second place First place 8.2 9.1 9.6 15.2 14.1 13.4 Primary Scales of Measurement
Table 8.1 Primary Scales of Measurement
Figure 8.2 Scaling Techniques Noncomparative Scales Comparative Scales Continuous Rating Scales Itemized Rating Scales Paired Comparison Rank Order Constant Sum Q-Sort and Other Procedures Semantic Differential Stapel Likert A Classification of Scaling Techniques
Comparative scales involve the direct comparison of stimulus objects. Comparative scale data must be interpreted in relative terms and have only ordinal or rank order properties. In noncomparative scales, each object is scaled independently of the others in the stimulus set. The resulting data are generally assumed to be interval or ratio scaled. A Comparison of Scaling Techniques
Small differences between stimulus objects can be detected. Same known reference points for all respondents. Easily understood and can be applied. Involve fewer theoretical assumptions. Tend to reduce halo or carryover effects from one judgment to another. Relative Advantages of Comparative Scales
Ordinal nature of the data Inability to generalize beyond the stimulus objects scaled. Relative Disadvantages of Comparative Scales
A respondent is presented with two objects and asked to select one according to some criterion. The data obtained are ordinal in nature. Paired comparison scaling is the most widely-used comparative scaling technique. With n brands, [n(n - 1) /2] paired comparisons are required. Under the assumption of transitivity, it is possible to convert paired comparison data to a rank order. Comparative Scaling TechniquesPaired Comparison Scaling
Instructions: We are going to present you with ten pairs of shampoo brands. For each pair, please indicate which one of the two brands of shampoo you would prefer for personal use. Recording Form: aA 1 in a particular box means that the brand in that column was preferred over the brand in the corresponding row. A 0 means that the row brand was preferred over the column brand. bThe number of times a brand was preferred is obtained by summing the 1s in each column. Obtaining Shampoo Preferences Using Paired Comparisons
Form Brand Rank Order 1. Crest _________ 2. Colgate _________ 3. Aim _________ 4. Gleem _________ 5. Sensodyne _________ 6. Ultra Brite _________ 7. Close Up _________ 8. Pepsodent _________ 9. Plus White _________ 10. Stripe _________ Preference for Toothpaste Brands Using Rank Order Scaling
Instructions On the next slide, there are eight attributes of bathing soaps. Please allocate 100 points among the attributes so that your allocation reflects the relative importance you attach to each attribute. The more points an attribute receives, the more important the attribute is. If an attribute is not at all important, assign it zero points. If an attribute is twice as important as some other attribute, it should receive twice as many points. Importance of Bathing Soap AttributesUsing a Constant Sum Scale
Fig. 8.5 cont. Form Average Responses of Three Segments Attribute Segment I Segment II Segment III 1. Mildness 2. Lather 3. Shrinkage 4. Price 5. Fragrance 6. Packaging 7. Moisturizing 8. Cleaning Power 8 2 4 2 4 17 3 9 7 53 17 9 9 0 19 7 5 9 5 3 20 13 60 15 100 100 100 Sum Importance of Bathing Soap AttributesUsing a Constant Sum Scale
Respondents evaluate only one object at a time, and for this reason non-comparative scales are often referred to as monadic scales. Non-comparative techniques consist of continuous and itemized rating scales. Noncomparative Scaling Techniques
Respondents rate the objects by placing a mark at the appropriate position on a line that runs from one extreme of the criterion variable to the other. The form of the continuous scale may vary considerably. How would you rate Sears as a department store? Version 1 Probably the worst - - - - - - -I - - - - - - - - - - - - - - - - - - - - - - Probably the best Version 2 Probably the worst - - - - - - -I - - - - - - - - - - - - - - - - - - - - - --Probably the best 0 10 20 30 40 50 60 70 80 90 100 Version 3 Very bad Neither good Very good nor bad Probably the worst - - - - - - -I - - - - - - - - - - - - - - - - - - - - ---Probably the best 0 10 20 30 40 50 60 70 80 90 100 Continuous Rating Scale
The respondents are provided with a scale that has a number or brief description associated with each category. The categories are ordered in terms of scale position, and the respondents are required to select the specified category that best describes the object being rated. The commonly used itemized rating scales are the Likert, semantic differential, and Stapel scales. Itemized Rating Scales
The Likert scale requires the respondents to indicate a degree of agreement or disagreement with each of a series of statements about the stimulus objects. Strongly Disagree Neither Agree Strongly disagree agree nor agree disagree 1. Sears sells high quality merchandise. 1 2X 3 4 5 2. Sears has poor in-store service. 1 2X 3 4 5 3. I like to shop at Sears. 1 2 3X 4 5 The analysis can be conducted on an item-by-item basis (profile analysis), or a total (summated) score can be calculated. When arriving at a total score, the categories assigned to the negative statements by the respondents should be scored by reversing the scale. Likert Scale
The semantic differential is a seven-point rating scale with end points associated with bipolar labels that have semantic meaning. SEARS IS: Powerful --:--:--:--:-X-:--:--: Weak Unreliable --:--:--:--:--:-X-:--: Reliable Modern --:--:--:--:--:--:-X-: Old-fashioned The negative adjective or phrase sometimes appears at the left side of the scale and sometimes at the right. This controls the tendency of some respondents, particularly those with very positive or very negative attitudes, to mark the right- or left-hand sides without reading the labels. Individual items on a semantic differential scale may be scored on either a -3 to +3 or a 1 to 7 scale. Semantic Differential Scale
A Semantic Differential Scale for Measuring Self- Concepts, Person Concepts, and Product Concepts 1) Rugged :---:---:---:---:---:---:---: Delicate 2) Excitable :---:---:---:---:---:---:---: Calm 3) Uncomfortable :---:---:---:---:---:---:---: Comfortable 4) Dominating :---:---:---:---:---:---:---: Submissive 5) Thrifty :---:---:---:---:---:---:---: Indulgent 6) Pleasant :---:---:---:---:---:---:---: Unpleasant 7) Contemporary :---:---:---:---:---:---:---: Obsolete 8) Organized :---:---:---:---:---:---:---: Unorganized 9) Rational :---:---:---:---:---:---:---: Emotional 10) Youthful :---:---:---:---:---:---:---: Mature 11) Formal :---:---:---:---:---:---:---: Informal 12) Orthodox :---:---:---:---:---:---:---: Liberal 13) Complex :---:---:---:---:---:---:---: Simple 14) Colorless :---:---:---:---:---:---:---: Colorful 15) Modest :---:---:---:---:---:---:---: Vain
The Stapel scale is a unipolar rating scale with ten categories numbered from -5 to +5, without a neutral point (zero). This scale is usually presented vertically. SEARS +5 +5 +4 +4 +3 +3 +2 +2X +1 +1 HIGH QUALITY POOR SERVICE -1 -1 -2 -2 -3 -3 -4X -4 -5 -5 The data obtained by using a Stapel scale can be analyzed in the same way as semantic differential data. Stapel Scale
Table 9.1 Scale Basic Examples Advantages Disadvantages Characteristics Continuous Place a mark on a Reaction to Easy to construct Scoring can be continuous line TV cumbersome Rating commercials unless Scale computerized Itemized Rating Scales Likert Scale Degrees of Measurement Easy to construct, More agreement on a 1 of attitudes administer, and time - consuming (strongly disagree) understand to 5 (strongly agree) scale Semantic Seven - point scale Brand, Versatile Controversy as with bipolar labels product, and to whether the Differential company data are interval images Stapel Unipolar ten - point Measurement Easy to construct, Confusing and scale, - 5 to +5, of attitudes administer over difficult to apply Scale witho ut a neutral and images telephone point (zero) Basic Noncomparative Scales