Download
1 / 19
240 likes | 427 Views
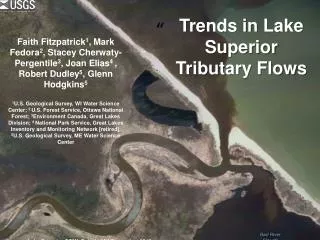
2000 HN210 Chl. The Deep Chlorophyll Maximum in Lake Superior. M.T. Auer, L.A. Bub and K.D. Elenbaas Department of Civil and Environmental Engineering Michigan Technological University. HN Transect - Chl (µg•L -1 ). 4/28/00. 6/22/00. 7/30/00. 8/25/00. 10/20/00.

E N D
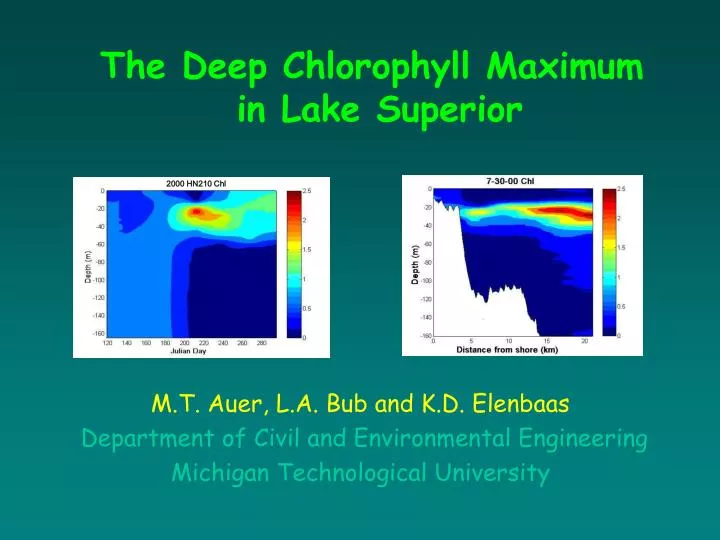
2000 HN210 Chl The Deep Chlorophyll Maximum in Lake Superior M.T. Auer, L.A. Bub and K.D. Elenbaas Department of Civil and Environmental Engineering Michigan Technological University
HN Transect - Chl (µg•L-1) 4/28/00 6/22/00 7/30/00 8/25/00 10/20/00 seasonal development of the DCM
Reported in both freshwater and marine systems and related to a variety of environmental factors
But it comes down to two camps … Or more simply, “Is the DCM a great place to live … or are they just hanging around?
The Ecological chemoautotrophs
ELF ELF nutrient supply ELF-APA Data from Vickie Morris, MTU Gloeocystis Fragilaria ELF (Enzyme-Labeled Fluorescence) is an alkaline phosphatase substrate which yields a bright yellow-green fluorescent precipitate upon enzymatic cleavage.
nutrient supply APA Vmax µM/min ELF Activity % of cells 81% 0.073 0.037 61% 0.025 65%
temperature optima Optimum T @ ~15 °C T in DCM ~ 4-5 °C
0 -10 -20 -30 -40 -50 300 350 400 450 500 550 600 650 700 light efficiency HN090 - JD 239 3-5% 1% light level, m 1-3% 0.6-1% wavelength, nm
chlorophyll adaptation July and August Offshore Stations carbon data courtesy of Noel Urban Shade adaptation does account for some of the DCM, but certainly not all of it. The maximum is also present in the carbon data.
grazing pressure chlorophyll (25-40 m) temperature (0-20 m) zooplankton (15-30 m) 0 m 10 m 20 m 30 m 40 m 50 m 60 m OPC scans provided by David J. Osterberg, MTU
Production (mg C m-3 h-1) 0.00 0.05 0.10 0.15 0.20 Chlorophyll (mg L-1) 0.0 0.5 1.0 1.5 2.0 let’s ask the bacteria Carbon Source Utilization 22m 5m PC2 50m August 1999 HN210 PC1
Excretion BCR (mg C m-3 h-1) (mg C m-3 h-1) 0.00 0.25 0.50 0.00 0.25 0.50 0 25 Depth (m) 50 75 100 … and furthermore Carbon excretion by actively photosynthesizing phytoplankton is able to satisfy the bacterial carbon requirement (BCR) only in the surface waters.
9/24/00 7/30/00 6/22/00 The Expanding Universe Chl (µg/L) T °C
Conversation Overheard at 30m … Hey! Is this a great place to live? Naw. We’re just hangin’ around.
For field support: Captain & Crew of the R/V Laurentian For assistance in data analysis: Jae Jeong, MTU For data: Angela Cates, LLO Judy Budd, MTU Kim Elenbaas, MTU Sarah Green, MTU Vickie Morris, MTU Dave Osterberg, MTU Noel Urban, MTU For financial support: National Science Foundation acknowledgements: