Download
1 / 52
520 likes | 761 Views
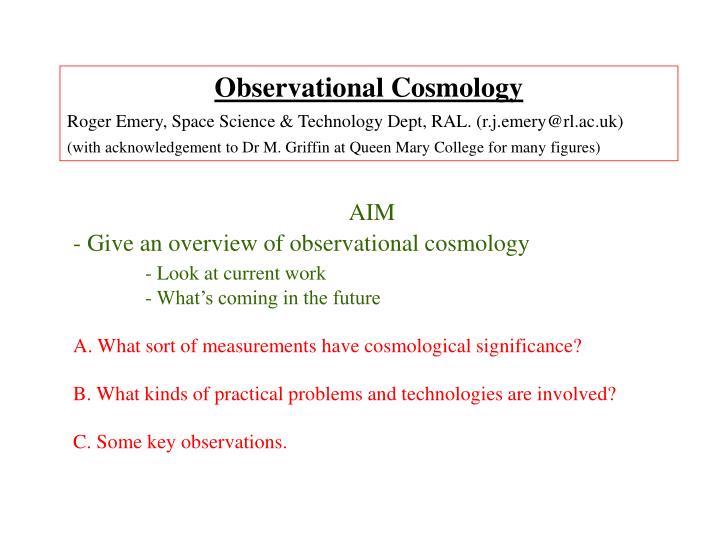
Observational Cosmology Roger Emery, Space Science & Technology Dept, RAL. (r.j.emery@rl.ac.uk) (with acknowledgement to Dr M. Griffin at Queen Mary College for many figures). AIM - Give an overview of observational cosmology - Look at current work - What’s coming in the future

E N D
Observational Cosmology Roger Emery, Space Science & Technology Dept, RAL. (r.j.emery@rl.ac.uk) (with acknowledgement to Dr M. Griffin at Queen Mary College for many figures) AIM - Give an overview of observational cosmology - Look at current work - What’s coming in the future A. What sort of measurements have cosmological significance? B. What kinds of practical problems and technologies are involved? C. Some key observations.
A. What sort of measurements have cosmological significance? - Measurements of the distance scale of sources / the Universe. - Large scale structure - Source counts versus ‘distance’ - Stellar and galactic evolution. - Abundance of the elements. - Cosmic Microwave Background. - The mass of galaxies / in the Universe - Particle accelerators and the structure of matter.
1. Parallax (Using the orbit of the Earth around the Sun as a baseline). * PARSEC(pc) - distance at which a star would have a parallax of 1 arc second = 3.1x10¹⁶metres 3.26 light years. - Primary observations allowed 1000 stars to be measured, including Centauri (1.3pc) - Hipparcos (ESA) satellite: Accuracy of parallax measurement 1 milli arcsec so has measured out to 1000pc (1kpc). Compare Orion region at 1.5 kpc, Galactic centre at 8 kpc or LMC at 55 kpc, Andromeda at 770 kpc - Local group of galaxies - New proposals for satellites, e.g. GAIA, aiming for few micro arcsec. 2. Standard Candles. - Cepheid variable stars - Takes measurements to limits of the Local Supercluster and beyond (~ 15Mpc) - Novae - Supernovae etc.
- Supernovae as distance indicators, as discussed by Robert Laing yesterday.
Speed = H x Distance 60,000 Speed of recession (v) (km/second) 40,000 20,000 0 3000 4000 1000 2000 Distance (Millions light years) THE HUBBLE PARAMETER, H How fast is the expansion today? Z=0.25 H = 40 - 80 km/s/Mpc 1227Mpc How long since the big bang? 10 - 15 billion years Red shift (z) = /o , [ 1+z = (1+v/c)/(1-(v/c)2 )1/2 ] therefore z v/c
Large scale structure can now be measured THE COMA CLUSTER OF GALAXIESPart of the Local Supercluster
Massive hot stars (20–50,000 K) form in the cloud and emit mainly UV radiation ( ~ 0.1 - 0.3 m) The UV radiation is absorbed by dust grains in the cloud The grains are warmed up to about 40 K and re-emit the energy as far infrared radiation ( ~ 50 - 100 m) 1. Galactic and stellar evolution STAR-FORMING CLOUDS SHINE MAINLY IN THE FAR INFRARED
2. STELLAR and GALACTIC EVOLUTION STAR-BURST CAUSED BY MERGING GALAXIESThe Antenna Galaxy
Optical/Near- Infrared Far infrared 13 12 11 Luminosity (L) 10 9 8 7 0.1 1 10 100 1000 Wavelength (m) Observing and understanding Galactic emission. TYPICAL SPECTRA OF NEARBY STARBURST GALAXIES
10 102L Z = 0.1 1 0.5 0.1 Flux density (Jy) 1 3 0.01 5 0.001 0.0001 10 100 1,000 10,000 l(mm) REDSHIFTED SPECTRA OF STARBURST GALAXIES
No correction for dust extinction Star-formation rate Extinction corrected Redshift STAR-FORMATION HISTORY OF THE UNIVERSE Optical and UV measurements
Universe was opaque before recombination Last scattering surface T ~ 300,000 yrsz ~ 1000 z ~ 5 Today qHorizon 2o Typical CBRphoton Less dense than average More dense than average Hot spot Cold spot The Cosmic Microwave Background Big Bang
< 1 Negativecurvature Distance = 1 Flat > 1 Positivecurvature Time The Amount of Matter in Galaxies and the Universe THE DENSITY PARAMETER, Current evidence: is between 0.3 and 2
WHAT DO ASTRONOMERS WANT TO MEASURE? INTENSITY of electromagnetic radiation, as a function of : FREQUENCY - Photometry, Spectroscopy POSITIONon the sky - Imaging TIME - Variability POLARISATION - Polarimetry Sensitivity: as high as possible Angular (spatial) resolution: Good enough to resolve interesting spatial details of the source(s) Spectral (wavelength) resolution: Good enough to resolve details and features of the spectral distribution of the source intensity Wavelength coverage: Wide enough to take in all parts of the spectrum that contain useful information
OBSERVATIONAL REQUIREMENTS FOR STUDYING GALAXY FORMATION • Very high sensitivity – objects are at immense distances • Good angular resolution to avoid confusion (overlapping sources) • Observations at different wavelengths • Optical/NIR: source positions and redshifts, galaxy type, chemistry, etc. (HST, NGST, large ground-based telescopes) • FIR-mm: re-processed and redshifted UV (FIRST, SCUBA, Millimetre Arrays)
BACKGROUND-LIMITED SENSITIVITY FOR A PHOTON COUNTING DETECTOR S = Signal DS = Uncertainty in signalNS = Signal photon rate (photons/second/Hz) NB = Background photon rateDn = Bandwidth of radiation frequencies acceptedt = Exposure (integration) time
Use a big telescope Accept a wide band of frequencies Collect photons for a long time Reduce unwanted background radiation:e.g:• Cool the instrument and/or telescope• Get above the Earth’s atmosphere HOW TO GET GOOD SENSITIVITY:
JFET box at 50 K(JFETs at 100 K) Back-to-back horns at 4 K Filters at 1.6 K Bolometers, horns and filters at 0.1 K Mounting flange (20 K) A modern cryogenic focal plane: Planck HFI instrument.
STORAGE TANKS FLOW CONTROL 4He CRYO-COOLER 4-K COLD TIP 3He GAS EXHAUST TO SPACE 4-K SHIELD 2-K HEAT EXCHANGER 2-K SHIELD HEAT EXCHANGER GAS EXPANSION PRODUCING 2-K 3He - 4He MIXING 0.1 K STAGE Cryogenic system for far-infrared instrument.
Very high sensitivity bolometric detector:- operating at 100mK (so-called Spider-web detector)- Ge:Ga NTD thermometer. Sensitivity: 1x10-17 W/Hz1/2
Atmosphere THE EFFECTS OF ATMOSPHERIC TURBULENCE = 550 nm Theoretical Achieved Resolution Resolution ("seeing") Palomar 5-m: 0.03" ~ 1”Keck 10-m: 0.015" ~ 1" HST 2.4-m: 0.06" ~0.06" Plane wavefront at top of atmosphere Distorted (corrugated) wavefront at the ground Distortion varies: Timescale of ~ 10 ms (coherence time) Length scale of ~ 30 cm (coherence length)
WAVEFRONT DISTORTIONS 1st order distortion (wavefront tilt): Image “dances around” in the focal plane 2nd order distortion (wavefront curvature): Image comes in and out of focus
Hubble Space Telescope0.6 m SCUBA on the JCMT850 m Infrared Space Observatory 7 m THE EAGLE NEBULA
COBE SATELLITE (1989) FIRASFar Infrared Absolute Spectrometer Measured CBR spectrum DMRDifferential Microwave Radiometer Measured spatial fluctuations in CBR temperature
COBE FIRAS TCBR = 2.73 K
0.1% Photon frequency increased Hotter 100% Photon frequency decreased Colder SMALL VARIATIONS IN TCBR DETECTED BY COBE DMR Variation of 3 mK
Random variations of about 20 K 20 K EVEN SMALLER VARIATIONS IN TCBR 3 mK
Our galaxy Hot gas in clusters of galaxies FOREGROUNDS MUST BE SUBTRACTED Instrument noise Other galaxies The real signal
(mm) (cm) Free-free Synchrotron q = 30 arcmin. (T/T)rms Dust Trms (K) q = 10 arcmin. (T/T)rms n (GHz) n (GHz) FOREGROUND FLUCTUATION LEVELS EXTRAGALACTIC POINT SOURCES GALACTIC (HIGH LATITUDE) Best frequency for cosmological signal ~ 150 GHz
PRIMORDIAL FLUCTUATION SPECTRUM T T Large angularscales 1/(Angular scale) Small angularscales EVOLUTION T T TODAY 1/(Angular scale) Small angularscales Large angularscales HOW THE CBR POWER SPECTRUM SHOULD EVOLVE
Angular scales probed by COBE T T Depends on , B, H, etc. Primordial ANGULAR POWER SPECTRUM OF CBR VARIATIONS (INFLATIONARY CDM MODEL with o = 1) Angle (degrees) 0.1 10 1 Large angles (1/Angular scale) Small angles
HOW TO MEASURE THE CBR VARIATIONS VERY WELL 1. Measure to one part in 1,000,000 Use a cold telescopeand put it as far away from the Earth as possible 2. Cover a large amount of sky 3. Observe in the 1 - 2 mm wavelength region 4. Use a big telescope to see fine details (resolution of ~ 0.1o = 6 arcminutes) 5. Look through the fog . . .
PLANCK ORBIT AND SKY MAPPING STRATEGY Planck at L2 Earth 1.5 million kmfrom Earth Sun
SIMULATED COBE SKY MAPCDM MODEL = 1 Beam = 7 oT/T = 2 x 10⁻⁵ SIMULATED PLANCK SKY MAPCDM MODEL = 1 Beam = 1/6 oT/T = 2 x 10⁻⁶
MAP Planck CBR ANISOTROPIES AFTER MAP AND PLANCK • H, , B, will be measured to an accuracy of a few % • The inflation theory will be tested • The origin of cosmic structure will be known
ACCURACY OF RETRIEVAL OF FUNDAMENTAL PARAMETERS FROM PLANCK CBR ANISOTROPY MAPS b H o 1- uncertainty (%) 1/3 sky coverageT/T = 2 x 10⁻⁶ per pixel Angular resolution (degrees)
The Atacama Large Millimetre Array (ALMA) Multi-element interferometer with ~ 60 12-m antennas Mountain-top site in Chile (alt. 5000 m) Variable configuration (100 m – 10 km) Angular resolution ~ 20 milli-arcseconds Operating ~ 2008
Far Infrared Space Telescope (FIRST) 3.5-metre telescope, cooled to ~ 80 K Sunshield with solar panels on other side Star-trackers for pointing 2500-litre tank of liquid helium cools instruments inside to 2 K Warm electronics and thrusters Wavelength range50 - 700 m Major scientific projects:- Study of distant galaxies- Star formation - Interstellar chemistry