Download
1 / 12
120 likes | 133 Views
Explore how beamforming through post-processing and time-domain processing produce 3D images for gas spectroscopy applications. Learn how to identify gas molecules with terahertz spectroscopy using frequency combs for enhanced detection.

E N D
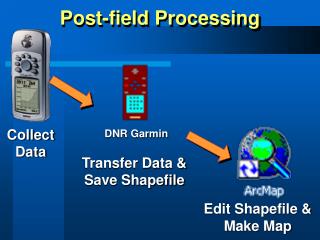
BeamformingThroughPost-Processing at the ReceiverTime-Domain ProcessingProducing 3D ImagesGas Spectroscopy
BeamformingThroughPost-Processing at the Receiver • The impulses radiated from different elements in the synthetic array travel different distances to a certain point P (x, y, z) in the 3-D space.
Therefore, the radiated impulses from all elements in the synthetic array can be aligned at point P when the appropriate time delays are added to the radiated impulses. • Alternatively, these delays can be added at the receiver during post-processing. In our experiment, because a synthetic transmitter array is used, beamforming is done by post-processing the received waveforms.
Time-Domain Processing • Based on time-of-flight information, the received waveforms reflected from point P are filtered in time and saved.
If there is no object at point P, the image-pixel intensity of point P is a negligible number (noise) because no reflection happens at point P.
If there is an object at point P, the image-pixel intensity of point P becomes a large number proportional to the reflection coefficient of an object located in point P.
Producing 3D Images • A 2D cross section can be generated by scanning point P on an image plane, which is defined as a finite XY plane with a fixed Z coordinate. • The 3-D images are generated by varying the value of the Z coordinate of the image plane.
At Z = 20 cm, no object is detected. At Z = 25 cm, which is the exact Zcoordinate of the object.
Gas Spectroscopy • Terahertz spectroscopy using frequency combs has become an effective technique for identifying gas molecules. • This technique can be used to detect the absorption lines in gases caused by transitions between rotational states in the terahertz spectral range.
A D2I chip as shown in Figure radiates 5.4-ps impulses and a Virginia Diodes harmonic mixer coupled with a Keysight signal analyzer.
N9030A is used to receive the impulses. Showsthe absorption spectrum of ammonia gas with a 1% concentration in two different pressure levels. • These results match with the expected absorption line of NH3 gas at 572 GHz.