Download

1 / 78
1.21k likes | 2.36k Views
Planning a Software Project. Agenda. Background Effort estimation Schedule and resource estimation Quality Planning Risk management Project monitoring plans. Software Project. Goal: Build a software system to meet commitments on cost, schedule, scope, quality

E N D
Agenda • Background • Effort estimation • Schedule and resource estimation • Quality Planning • Risk management • Project monitoring plans Project Planning
Software Project • Goal: Build a software system to meet commitments on cost, schedule, scope, quality • Worldwide - many projects fail • one-third are runaways with cost or schedule overrun of more than 125% Project Planning
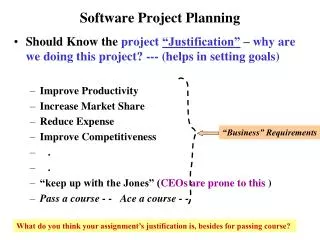
Project Failures • Major reasons for project runaways • unclear objectives • bad planning • no project management methodology • new technology • insufficient staff • All of these relate to project management • Effective project management is key to successfully executing a project Project Planning
Why improve PM? • Better predictability leading to commitments that can be met • Lower cost through reduced rework, better resource mgmt, better planning,.. • Improved quality through proper quality planning and control • Better control through change control, change management (CM), monitoring etc. Project Planning
Why improve PM …. • Better visibility into project health and state leading to timely intervention • Better handling of risks reducing the chances of failure • All this leads to higher customer satisfaction • And organization improvement Project Planning
The Project Mgmt Process • Has three phases - planning, monitoring and control, and closure • Planning is done before the much of the engineering process (life cycle, LC) and closure after the process • Monitoring phase is in parallel with LC • We focus on planning; monitoring covered through its planning Project Planning
Project Planning • Basic objective: To create a plan to meet the commitments of the project, I.e. create a path that, if followed, will lead to a successful project • Planning involves defining the life cycle (LC) process to be followed, estimates, detailed schedule, plan for quality, etc. • Main output - a project management plan and the project schedule Project Planning
Key Planning Tasks • Estimate effort • Define project milestones and create a schedule • Define quality objectives and a quality plan • Identify risks and make plans to mitigate them • Define measurement plan, project-tracking procedures, training plan, team organization, etc. Project Planning
Effort Estimation For a software development project, overall effort and schedule estimates are essential prerequisites for planning the project. The accuracy with which effort can be estimated clearly depends on the level of information available about the project. The more detailed the information, the more accurate the estimation can be.
Effort Estimation • For a project total cost and duration has to be committed in start • Requires effort estimation, often in terms of person-months • Effort estimate is key to planning - schedule, cost, resources depend on it • Many problems in project execution stem from improper estimation Project Planning
Estimation.. • No easy way, no silver bullet • Estimation accuracy can improve with more information about the project • Early estimates are more likely to be inaccurate than later • More uncertainties in the start • With more info, estimation becomes easier Project Planning
Effort Estimation Models.. • A model tries to determine the effort estimate from some parameter values • A model also requires input about the project, and cannot work in vacuum • So to apply a model, we should be able to extract properties about the system • Two types of models - top-down and bottom-up Project Planning
Effort Estimation Models Project Planning
Top down estimation • The effort for a project is a function of many parameters, it is generally agreed that the primary factor that controls the effort is the size of the project. • The larger the project, the greater is the effort requirement. The top down approach utilizes this and considers effort as a function of project size. • First determine the nature of the function, and then to apply the function, then to estimate the size of the project for which effort is to be estimated. Project Planning
Top down estimation • First determines the total effort, then effort for components • Simple approach – estimate effort from size and productivity • Get the estimate of the total size of the software • Estimate project productivity using past data and project characteristics • Obtain the overall effort estimate from productivity and size estimates • Effort distribution data from similar project are used to estimate effort for different phases Project Planning
Top-down Estimation • A better method is to have effort estimate as a function of size using: Effort (E) = a * size b • E is in person-months, size in KLOC or function points • Incorporates the observation that productivity can dip with increased size • Constants a and b determined through regression analysis of past project data Project Planning
Constructive Cost Model (COCOMO) • Uses size, but adjusts using some factors • Basic procedure • Obtain initial estimate using size • Determine a set of15 multiplying factors from different project attributes • Adjust the effort estimate by scaling it with the final multiplying factor Project Planning
COCOMO.. • Initial estimate: a * size b ; some standard values for a, b given for diff project types • There are 15 cost driver attributes like reliability, complexity, application experience, capability, … • Each factor is rated, and for the rating a multiplication factor is given • Final effort adjustment factor is the product of the factors for all 15 attributes Project Planning
COCOMO – Some cost drivers COCOMO uses a set of 15 different attributes of a project called cost driver attributes Project Planning
COCOMO – Example • For example, Watson and Felix [81] analyzed the data of more than 60 projects done at IBM Federal Systems Division, ranging from 4000 to 467,000 lines of delivered source code, and found that if the SIZE estimate is in thousands of delivered lines of code (KLOC), the total effort, E, in person-months (PM) can be given by the equation. • E = 5.2(SIZE) .91 • In the Constructive Cost Model (COCOMO) [12, 13], for the initial estimate (also called nominal estimate) the equation for an organic project is • E = 3.9(SIZE) .91 Project Planning
COCOMO – Example • The multiplying factors for all 15 cost drivers are multiplied to get the effort adjustment factor (EAF). The final effort estimate, E, is obtained by multiplying the initial estimate by the EAF. In other words, adjustment is made to the size-based estimate using the rating for these 15 different factors. • As an example, consider a system being built for supporting auctions in a university, it is decided that the system will comprise a few different modules. The modules and their expected sizes are: Project Planning
COCOMO – Example • Login 200 LOC • Payment 200 LOC • Administrator interface 600 LOC • Seller functions 200 LOC • Buyer functions 500 LOC • View and bookkeeping 300 LOC • TOTAL 2000 LOC • The total size of this software is estimated to be 2 KLOC. • If we want to use COCOMO for estimation, we should estimate the value of the different cost drivers. Suppose we expect that the complexity of the system is high, the programmer capability is low, and the application experience of the team is low. All other factors have a nominal rating. Project Planning
COCOMO – Example • Effort adjustment factor (EAF) is • EAF = 1.15 * 1.17 * 1.13 = 1.52. • The initial effort estimate for the project is obtained from the relevant equations. • Ei = 3.9 2.91 = 7.3 PM. • Using the EAF, the adjusted effort estimate is • E = 1.52 7.3 = 11.1 PM. Project Planning
COCOMO – effort distribution • Effort distribution among different phases is given as a percent of effort • Eg. Project Planning
The procedure for estimation can be summarized as the following sequence of steps: 1. Identify modules in the system and classify them as simple, medium, or complex. 2. Determine the average coding effort for simple/medium/complex modules. 3. Get the total coding effort using the coding effort of different types of modules and the counts for them. 4. Using the effort distribution for similar projects, estimate the effort for other tasks and the total effort. 5. Refine the estimates based on project-specific factors.
Bottom-up Estimation • An alternate approach to top-down • Effort for components and phases first estimated, then the total • Project is first divided into tasks and then estimates for the different tasks of the project are obtained. From the estimates of the different tasks, the overall estimate is determined. • Can use activity based costing - all activities enumerated and then each activity estimated separately • Can group activities into classes - their effort estimate from past data Project Planning
An Estimation Procedure • Identify programs in the system and classify them as simple, medium, or complex (S/M/C) • Define the average coding effort for S/M/C • Get the total coding effort. • Use the effort distribution in similar projects to estimate effort for other tasks and total • Refine the estimates based on project specific factors Project Planning
Project Schedule • A project Schedule is at two levels - overall schedule and detailed schedule • Overall schedule comprises of major milestones and final date • Detailed schedule is the assignment of lowest level tasks to resources Project Planning
Overall Schedule • Depends heavily on the effort estimate • For an effort estimate, some flexibility exists depending on resources assigned • Eg a 56 person-months project can be done in 8 months with 7 people, or 7 months with 8 people • Stretching a schedule is easy; compressing is hard and expensive Project Planning
Overall Scheduling... • One method is to estimate schedule S (in months) as a function of effort in PMs • Can determine the function through analysis of past data; the function is non linear • COCOMO: S = 2.5 E .38 • IBM Federal Systems Division: S = 4.1 E.36. • Often this schedule is checked and corrected for the specific project Project Planning
Determining Overall Schedule from past data Project Planning
Overall Scheduling... • Another method for checking a schedule for medium-sized projects is the rule of thumb called the square root check . • This check suggests that the proposed schedule can be around the square root of the total effort in person-months. • This schedule can be met if suitable resources are assigned to the project. • As schedule is not a function solely of effort, the schedule determined in this manner is essentially a guideline • For example, if the effort estimate is 50 person-months, a schedule of about 7 to 8 months will be suitable. Project Planning
Determining Milestones • With effort and overall schedule decided, avg project resources are fixed • Manpower ramp-up in a project decides the milestones • Manpower ramp-up in a project follows a Rayleigh curve - like a normal curve • In reality manpower build-up is a step function Project Planning
Manpower Ramp-up Team Size In the beginning and the end, few people are needed on the project; the peak team size (PTS) is needed somewhere near the middle of the project; and again fewer people are needed after that. Project Planning
Manpower Ramp-up • Given the effort estimate for a phase, we can determine the duration of the phase if we know the manpower ramp-up. • For these three major phases, the percentage of the schedule consumed in the build phase is smaller than the percentage of the effort consumed because this phase involves more people.. Project Planning
Manpower Ramp-up • For ease of scheduling, particularly for smaller projects, often the required people are assigned together around the start of the project. • This approach can lead to some people being unoccupied at the start and toward the end. • This slack time is often used for supporting project activities like training and documentation. Project Planning
Milestones ... • With manpower ramp-up and effort distribution, milestones can be decided • Effort distribution and schedule distribution in phases are different • Generally, the build has larger effort but not correspondingly large schedule • COCOMO specifies distribution of overall schedule: - • Design – 19%, • programming – 62%, • integration – 18% Project Planning
Detailed Scheduling • Detailed schedule not done completely in the start - it evolves • Can use Microsoft Project for keeping it • Detailed Schedule is the most live document for managing the project • Any activity to be done must get reflected in the detailed schedule Project Planning
Quality Planning • Delivering high quality is a basic goal • Quality can be defined in many ways • Current industry standard - delivered defect density (e.g. #defects/KLOC) • Defect - something that causes software to behave in an inconsistent manner • Aim of a project - deliver software with low delivered defect density Project Planning
Defect Injection and Removal • Software development is labor intensive • Defects are injected at any stage • As quality goal is low delivered defect density, these defects have to be removed • Done primarily by quality control (QC) activities of reviews and testing Project Planning
Defect Injection and Removal The QC activities for defect removal include requirements reviews, design reviews, code reviews, unit testing, integration testing, system testing, acceptance testing, etc Project Planning
Approaches to Quality Management • Ad hoc - some testing, some reviews done as and when needed • Procedural - defined procedures are followed in a project • Quantitative - defect data analysis done to manage the quality process Project Planning
Procedural Approach • A quality plan defines what QC tasks will be undertaken and when • Main QC tasks - reviews and testing • Guidelines and procedures for reviews and testing are provided • During project execution, adherence to the plan and procedures are ensured Project Planning
Quantitative Approach • Goes beyond asking “has the procedure been executed” • Analyzes defect data to make judgements about quality • Past data is very important • Key parameters - defect injection and removal rates, defect removal efficiency (DRE) Project Planning
Quality Plan • The quality plan drives the quality activities in the project • Must define QC tasks that have to be performed in the project • Can specify defect levels for each QC tasks Project Planning
Risk Management • Any project can fail - reasons can be technical, managerial, etc. • Project management aims to tackle the project management aspect • Engineering life cycles aim to tackle the engineering issues • A project may fail due to unforeseen events - risk management aims to tackle this Project Planning