Download
1 / 63
630 likes | 869 Views
Time-Frequency Analysis and Wavelet Transform Oral Presentation. Advisor: 丁建均 and All Class Members Student: 李境嚴 ID: D00945001. What’s Today?. XIII. Applications of Time–Frequency Analysis . (1) Finding Instantaneous Frequency (2) Signal Decomposition (3) Filter Design

E N D
Time-Frequency Analysis and Wavelet Transform Oral Presentation Advisor: 丁建均 and All Class Members Student: 李境嚴 ID:D00945001
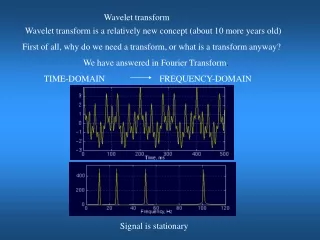
XIII. Applications of Time–Frequency Analysis (1) Finding Instantaneous Frequency (2) Signal Decomposition (3) Filter Design (4) Sampling Theory (5) Modulation and Multiplexing (6) Electromagnetic Wave Propagation (7) Optics (8) Radar System Analysis (9) Random Process Analysis (10) Music Signal Analysis (11) Acoustics (12) Biomedical Engineering (13) Spread Spectrum Analysis (14) System Modeling (15) Image Processing (16) Economic Data Analysis (17) Signal Representation (18) Data Compression (19) Seismology (20) Geology Biomedical Engineering Image Processing Wavelet Transform Laws Texture Kernel (Windows)
What’s Today? • Study of Classification of Lung Tumor Based on CT/PET Images • Technique of studying image ( gray level) • Training skill of machine learning
Why Image Processing? • Gray level studying • DSP, Kernel( window) • Resolution of image • 4000*3000, 1024*768, 640*480, 320*240 • How about in Biomedical Image?
Why Image Processing? • The Biomedical Image Today • CT: • 512*512 • PET: 128*128
Why Image Processing? Brain v.s. Lung Tumors
Outline Introduction and Back ground Technique Experiments Discussion and Conclusion
Introduction Introduction and Back ground Technique Experiments Discussion and Conclusion
Introduction • Lung Tumor • High Death Ratio • Nerve-less
Introduction Image Load Pre-processing Co-Registration Co-Registration Down / Up sampling ; Wavelet Transform Classification Feature Extraction Feature Extraction ROI Wavelet ; Laws Texture ; Other Methods
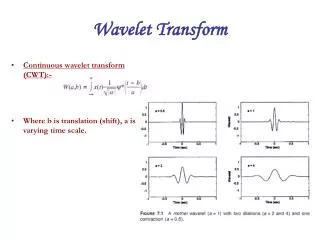
Introduction--Wavelet Transform J. J. Ding, 09月15日上課資料 , P 43 Wavelet Transform:
Introduction--Wavelet Transform Ivan W. Selesnick, Wavelet Transforms, 2007
Introduction Ivan W. Selesnick, Wavelet Transforms, 2007
Introduction--Wavelet Transform Ivan W. Selesnick, Wavelet Transforms, 2007
Introduction--Wavelet Transform Ivan W. Selesnick, Wavelet Transforms, 2007
Introduction--Wavelet Transform • Wavelet Transform: • Improvement??? • Haar !!
Introduction--Wavelet Transform • Haar Transform:
Introduction--Wavelet Transform Haar Transform Wavelet Transform
Introduction--Wavelet Transform J. J. Ding, 09月15日上課資料 , P 46 Wavelet Transform:
Introduction—Laws Texture http://www.ccs3.lanl.gov/~kelly/ZTRANSITION/notebook/laws.shtml • Laws features • The texture energy measures developed by Kenneth Ivan Laws at the University of Southern California have been used for many diverse applications. These measures are computed by first applying small convolution kernels to a digital image, and then performing a nonlinear windowing operation.
Introduction—Laws Texture M.T. Suzuki, Y. Yaginuma, H. Kodama, A Texture Energy Measurement Technique for 3D Volumetric Data,2009 IEEE International Conference on Systems http://www.ccs3.lanl.gov/~kelly/ZTRANSITION/notebook/laws.shtml • Laws features • 3element kernel • 5element kernel • High order kernel
Introduction—Laws Texture M.T. Suzuki, Y. Yaginuma, H. Kodama, A Texture Energy Measurement Technique for 3D Volumetric Data,2009 IEEE International Conference on Systems http://www.ccs3.lanl.gov/~kelly/ZTRANSITION/notebook/laws.shtml • Laws features • 3element kernel • Level: [1 2 1]; • Edge: [-1 0 1]; • Spot: [-1 2 -1];
Introduction—Laws Texture • Laws features
Introduction—Laws Texture M.T. Suzuki, Y. Yaginuma, H. Kodama, A Texture Energy Measurement Technique for 3D Volumetric Data,2009 IEEE International Conference on Systems http://www.ccs3.lanl.gov/~kelly/ZTRANSITION/notebook/laws.shtml • Laws features • 5element kernel • L5 = [1, 4, 6, 4, 1]; • E5 = [−1,−2, 0, 2, 1]; • S5 = [−1, 0, 2, 0,−1]; • R5 = [1,−4, 6,−4, 1]; % ripple • W5 = [−1, 2, 0,−2, 1]; % wave
Introduction—Laws Texture • Laws features
Introduction—Laws Texture M.T. Suzuki, Y. Yaginuma, H. Kodama, A Texture Energy Measurement Technique for 3D Volumetric Data,2009 IEEE International Conference on Systems http://www.ccs3.lanl.gov/~kelly/ZTRANSITION/notebook/laws.shtml • Laws features • Image processing --- 2D case L5L5 L5E5 L5S5 L5R5 L5W5 E5L5 E5E5 E5S5 E5R5 E5W5 S5L5 S5E5 S5S5 S5R5 S5W5 R5L5 R5E5 R5S5 R5R5 R5W5 W5L5 W5E5 W5S5 W5R5 W5W5
Introduction—Laws Texture • Laws features
Introduction—Laws Texture L5L5 S5S5 W5W5 R5R5 E5E5
Introduction-- Background CT - computed tomography PET - Positron emission tomography
Introduction-- Background • CT - Computed Tomography • Digital geometry processing is used to generate a three-dimensional image of the inside of an object from a large series of two-dimensional X-ray images taken around a single axis of rotation . • http://translate.google.com/translate?hl=zh-TW&langpair=en|zh-TW&u=http://en.wikipedia.org/wiki/X-ray_computed_tomography
Introduction-- Background • PET - Positron Emission Tomography • A nuclear medicine imaging technique that produces a three-dimensional image or picture of functional processes in the body. The system detects pairs of gamma rays emitted indirectly by a positron-emitting radionuclide (tracer), which is introduced into the body on a biologically active molecule. Three-dimensional images of tracer concentration within the body are then constructed by computer analysis. In modern scanners, three dimensional imaging is often accomplished with the aid of a CT X-ray scan performed on the patient during the same session, in the same machine. • If the biologically active molecule chosen for PET is FDG, an analogue of glucose, the concentrations of tracer imaged then give tissue metabolic activity, in terms of regional glucose uptake. Although use of this tracer results in the most common type of PET scan, other tracer molecules are used in PET to image the tissue concentration of many other types of http://en.wikipedia.org/wiki/Positron_Emission_Tomography
Introduction-- Background • PET - Positron emission tomography • FDG ( Fludeoxyglucose) : • 氟代脱氧葡萄糖 http://en.wikipedia.org/wiki/Positron_Emission_Tomography
Background CT V.S. PET
Technique Introduction and Back ground Technique Experiments Discussion and Conclusion
Technique Feature Extracting – 1 (on CT) Down sampling (for co-registry) Overlap CT/PET( Down/Up Sampling) Feature Extracting – 2 (on PET) Machine Learning
Background CT V.S. PET
Technique –Feature Extracting – 1 (on CT) • Feature Extracting – 1 (on CT) • Volume • Rectangular Fit • Histogram features • Laws features • Wavelet : : :
Technique –Down sampling (for co-registry) Raw Image Low Pass (Average) High Pass 1 (X direction) High Pass 2 (Y direction) High Pass 3 (Corner) Down sampling (for co-registry)
Technique –Down sampling (for co-registry) Raw Image Low Pass (Average) High Pass 1 (X direction) High Pass 2 (Y direction) High Pass 3 (Corner) Down-samples Image Down sampling (for co-registry)
Technique –Feature Extracting – 2 (on PET) • Feature Extracting – 2 (on PET) • SUV • Leveled SUV • Largest Region’s SUV • Other probability features
Technique –Feature Extracting – 2 (on PET) PAWITRA MASA-AH, SOMPHOB SOONGSATHITANON, A novel Standardized Uptake Value (SUV) calculation of PET DICOM files using MATLAB, NEW ASPECTS OF APPLIED INFORMATICS, BIOMEDICAL ELECTRONICS & COMMUNICATIONS Feature Extracting – 2 (on PET)
Technique –Feature Extracting – 2 (on PET) Tumor Level 3 Level 4 Level 1 Level 2 Level 5 Sub SUV Sub SUV Sub SUV Sub SUV Sub SUV Feature Feature Feature Feature Feature • Feature Extracting – 2 (on PET)
Technique –Machine Learning • Machine Learning • Logistic • Neural Network • SVM (Support Vector Machine) • J48