Download
1 / 18
180 likes | 312 Views
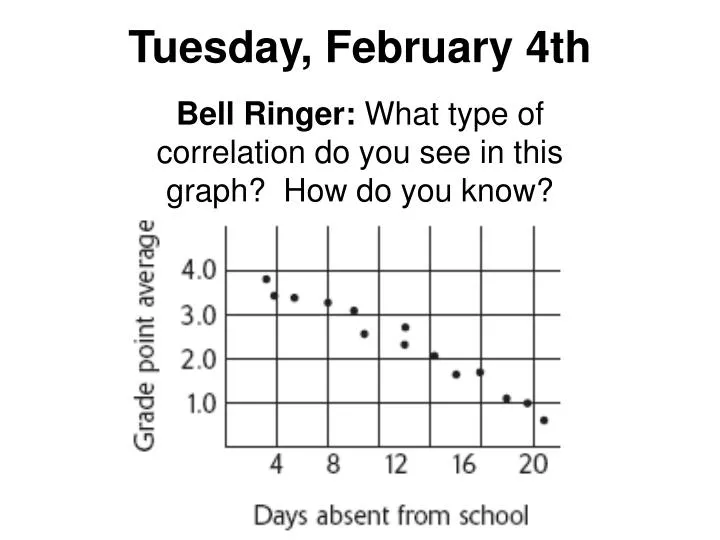
Tuesday, February 4th. Bell Ringer: What type of correlation do you see in this graph? How do you know?. Bell Ringer Review + HW Check. HW tracker. How are we doing. Objective:. I CAN write the equation of a trend line and use that to make predictions

E N D
Tuesday, February 4th Bell Ringer: What type of correlation do you see in this graph? How do you know?
HW tracker • How are we doing
Objective: • I CAN write the equation of a trend line and use that to make predictions • Homework: Complete the back of the sheet
POSITIVE NEGATIVE NO
Writing for math • Conclusion from the graph What type of correlation do you see? As the distance of a flight increases, the time of the flight increases Positive
Let’s draw a trend line (1864, 290) (307, 70)
(1864, 290) (307, 70) Write the equation
(1864, 290) (307, 70)
Now what do the slope and y intercept mean • Slope: represents the rate of change. • Y intercept: represents the value of y when x is 0
Let’s draw a trend line (1864, 290) (307, 70)
Answer these questions with your partner • What does the slope represent? • What does y – intercept mean? • Predict how long an 2000 mile flight would be? The number of minutes it takes to fly 1 mile How long it takes to fly 0 miles ????
Now let’s draw a line of fit for the cost vs distance scatter plot (1864, 290) (307, 70)
Answer these questions with your partner • What does the slope represent? • What does y – intercept mean? • Predict how much it will cost to fly to Miami (1190 miles from Chicago)? The cost per mile How much it costs to fly 0 miles ????