Download
1 / 1
10 likes | 118 Views
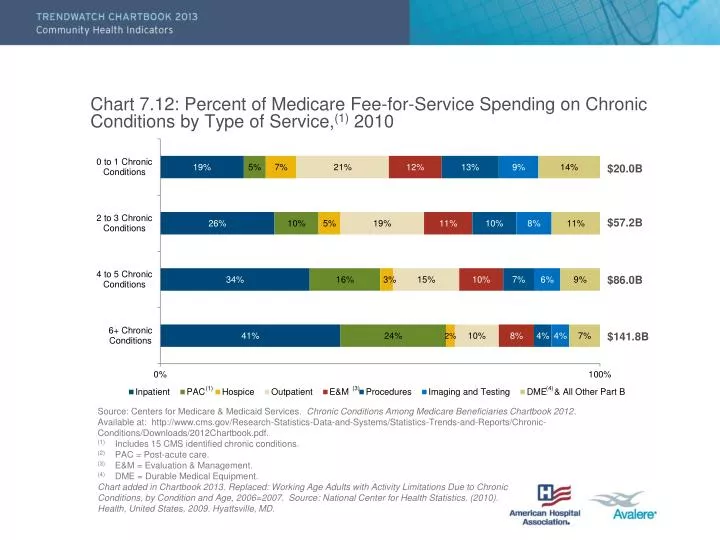
Chart 7.12: Percent of Medicare Fee-for-Service Spending on Chronic Conditions by Type of Service, (1) 2010. $20.0B. $57.2B. $86.0B. $141.8B. (1). (3). (4).

E N D
Chart 7.12: Percent of Medicare Fee-for-Service Spending on Chronic Conditions by Type of Service,(1) 2010 $20.0B $57.2B $86.0B $141.8B (1) (3) (4) Source: Centers for Medicare & Medicaid Services. Chronic Conditions Among Medicare Beneficiaries Chartbook 2012. Available at: http://www.cms.gov/Research-Statistics-Data-and-Systems/Statistics-Trends-and-Reports/Chronic-Conditions/Downloads/2012Chartbook.pdf. (1) Includes 15 CMS identified chronic conditions. (2) PAC = Post-acute care. (3) E&M = Evaluation & Management. (4) DME = Durable Medical Equipment. Chart added in Chartbook 2013. Replaced: Working Age Adults with Activity Limitations Due to Chronic Conditions, by Condition and Age, 2006=2007. Source: National Center for Health Statistics. (2010). Health, United States, 2009. Hyattsville, MD.