Download
1 / 33
370 likes | 541 Views
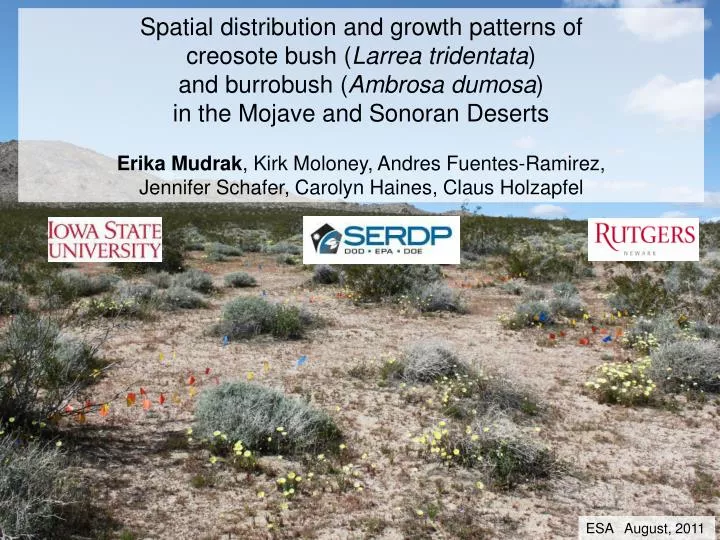
Spatial distribution and growth patterns of creosote bush ( Larrea tridentata ) and burrobush ( Ambrosa dumosa ) in the Mojave and Sonoran Deserts Erika Mudrak , Kirk Moloney, Andres Fuentes-Ramirez, Jennifer Schafer, Carolyn Haines, Claus Holzapfel. ESA August, 2011. N. S.

E N D
Spatial distribution and growth patterns of creosote bush (Larrea tridentata) and burrobush (Ambrosa dumosa) in the Mojave and Sonoran Deserts Erika Mudrak, Kirk Moloney, Andres Fuentes-Ramirez, Jennifer Schafer, Carolyn Haines, Claus Holzapfel ESA August, 2011
N S Holzapfel and Mahall 1999, Brooks 2002, Schenk et al. 2003, Esque et al. 2010
N S Invasion by Non-native Annuals Brooks 1999, Brooks 2000
N S Invasion by Non-native Annuals Fire Brooks and Matchett 2006
N S Invasion by Non-native Annuals Fire Ravi et al. 2009
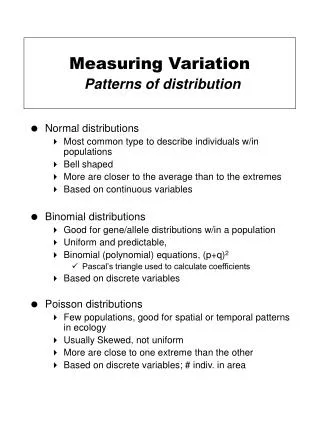
Project Goals: • Ultimate: • Develop landscape-scale, spatially-explicit agent-based models • - patterns of invasion by non-native plants • effect of fire cycle and climate change on these dynamics • test possible management plans • Current: • Characterization of landscape: • annual plant community • soil nutrient availability • water availability • microtopography • Step 1- Describe and • model shrub patterns
uniform random clustered clustered Inhibitory/over dispersed Competition Allelopathy Poisson No interaction Attractive clonal growth form short dispersal environmental heterogeneity
uniform random clustered clustered Inhibitory/over dispersed Attractive No interaction Scale of inhibition? Size of a cluster? Marked point pattern Multi-type point pattern
Aims Data acquisition represent shrub distribution as point patterns Exploratory and descriptive analyses Quantify spatial distribution of shrubs Modeling pattern generating processes Specify a pattern’s probability density – Gibbs Models Applications and future work
0 5 10 20 30 40 327520 327540 327560 327580 327600 Meters 3619260 3619230 3619200 3619170 3619140 GPS locations of shrub-island centers 3619110 Aerial Imagery taken May 2007, 50 cm resolution Study area in Barry M. Goldwater Range, AZ Sonoran Desert WGS84 UTM zone 12N map by Erika Mudrak for Desert Flame Research group, 12/16/2010
H D2 D1 creosote bush Larrea tridentata burrobush Ambrosia dumosa
0 5 10 20 30 40 327520 327540 327560 327580 327600 Meters 3619260 ¯ 3619230 3619200 3619170 3619140 GPS locations of shrub-island centers 3619110 Projection of bottom area of shrub islands, Aerial Imagery taken May 2007, 50 cm resolution modeled as ellipse from hand measurements (to scale, 20cm resolution) Study area in Barry M. Goldwater Range, AZ Sonoran Desert WGS84 UTM zone 12N map by Erika Mudrak for Desert Flame Research group, 12/16/2010
Aims • Data acquisition • Record distribution as point patterns • Exploratory and descriptive analyses • Quantify spatial distribution of shrubs • Modeling pattern generating processes • Specify a pattern’ probability density • Applications and future work
Sonoran Larrea 713 shrubs 591.25 m3 Mojave Ambrosia Mojave Larrea 1060 shrubs 303 shrubs 88.30 m3 797.25 m3
Sonoran Larrea 713 points 0.0661 shrubs/ m2 Pair correlation function (PCF) 95% critical envelope Regularly spaced to about 2.3 m radius (m) A. Baddeley and R. TurnerSpatstat: an R package for analyzing spatial point patterns.Journal of Statistical Software12 (2005) 1-42.
Sonoran Larrea Mark Correlation Function f=vol1*vol2 Conditional Mean radius (m) Shrubs with close neighbors tend to be smaller than average. Stoyan and Stoyan 1994 Schlather et al 2004
Voronoi Tesselation Larrea in Sonoran log (shrub volume) = -3.24 + 1.24*log (tile area) R2=0.21 *** Shrub volume (m3) Crowded shrubs tend to be smaller Polygon area (m2) Competition is important
Mojave Larrea and Ambrosia Larrea: 303 shrubs 0.028 shrubs / m2 Ambrosia: 1060 shrubs 0.098 shrubs / m2 PCF for Larrea alone Inhomogenous cross PCF Regularly spaced to about 3.15 m Larrea and Ambrosia inhibit each other radius (m) radius (m)
Mojave Larrea and Ambrosia Larrea Ambrosia Mark Correlation Function f=vol1*vol2 Conditional Mean radius (m) radius (m) Shrubs with close neighbors tend to be smaller than average.
Voronoi Tesselation Larrea and Ambrosia in Mojave log (shrub vol) = -0.98 + 0.65*log (tile area) R2=0.13 *** Shrub volume (m3) log (shrub vol) = -3.5 + 0.37*log (tile area) R2=0.05 *** Polygon area (m2) Crowded shrubs tend to be smaller Relationships not as strong as in Sonoran
Spatial Patterning: • - Competition is important: Crowded shrubs are smaller • - Sonoran Larrea are regularly spaced to about 2.3 m • Mojave Larrea are spaced to about 3.15 m • multispecies pattern and inhomogeneity of Ambrosia complicate things
Aims Data acquisition Record distribution as point patterns Exploratory and descriptive analyses Quantify spatial distribution of shrubs Modeling pattern generating processes Specify a pattern’s probability density Applications and future work
Sonoran Larrea • Strauss process • r : interaction radius • : strength of interaction • = 0: Poisson • = 1: Hard Core r • Fitted Strauss process • Sonoran Larrea • r =2.6 m • = 0.71
Generated Process Observed Pattern
Observed Pattern Generated Process
Summary • Fitting Gibbs models to observed point patterns can • Generalize landscape model results • Generalize model applications to different specific areas.
Future Directions • Incorporate environmental factors (topography, nutrients) into Gibbs models • Simultaneously model spatial location and shrub volume • Model soil nutrient pattern and annual patterns as functions of shrub size and distance to shrub
Questions? Acknowledgements Hadas Parag Mojave Desert: Dave Housman Alex Misiura, Ruth Sparks, Rodeway Inn Sonoran Desert: Richard Whittle, Teresa Walker, Yucca Motel
Strauss process • r : interaction radius • : strength of interaction • = 0: Poisson • = 1: Hard Core • Fitted Strauss process • Sonoran Larrea • r =2.6 m • = 0.71
Ambrosia Larrea Volume Inhomogenous Pair Correlation Function (Larrea and Ambrosia indistinct) Mark Correlation Function f=vol1*vol2 Conditional Mean