Download

1 / 14
140 likes | 163 Views
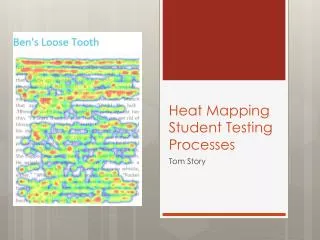
Uncover the power of heat mapping as a strategic planning tool to assess heat demand, analyze potential heat networks, and determine carbon impacts. Utilize GIS data, building attributes, and energy algorithms for precise demand modeling and supply-demand balance.

E N D
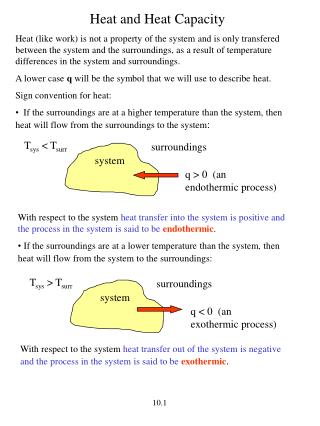
WHY? To provide a strategic planning tool for: • Assessing heat demand in a given area • Analysing that demand in terms of potential heat networks determine potential supply chains • Acting as a basis for determining carbon impacts
Input Data • GIS Buildings Shapefile (Master Map) • Building Use Class Data (Gazetteer) • Differentiation between Heated and Unheated Buildings (Postcode)
Energy Requirement Algorithm Radiant Surface Walls Radiant Surface Windows WALL: Window ratio Radiant Surface Roof Radiant Surface Floor Building Stories Room Height Air changes / hour Air Density Degree days Hot Water High U values Low U Values Average U Values Maximum Energy requirement and boiler size Minimum Energy requirement and boiler size Average Energy requirement and boiler size Demand Modelling
Thank You Chris Perkins Rural Development Manager Highland Birchwoods chris.perkins@highlandbirchwods.co.uk 01463 811611