Download
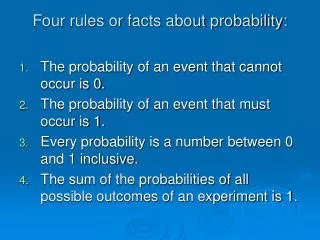
1 / 36
360 likes | 524 Views
Chapter 6: Probability. Inferential Statistics. Flow of inferential statistics and probability. Sample. Population. Probability. Jars of Marbles. Population 1. Population 2. 50 black marbles 50 red marbles. 9 0 black marbles 1 0 red marbles. P(black) = .50. P(black) = .90.

E N D
Inferential Statistics Flow of inferential statistics and probability Sample Population Probability
Jars of Marbles Population 1 Population 2 50 black marbles 50 red marbles 90 black marbles 10 red marbles P(black) = .50 P(black) = .90
Jars of Marbles Population 1 Population 2 50 black marbles 50 red marbles 90 black marbles 10 red marbles Sample of n = 4 selected. All 4 marbles are black. Which population did it come from?
Probability Equation Number of outcomes classified as A Probability of A = Total number of possible outcomes
Probability is Proportion • Coin tosses -- p (heads) = ? • Cards • p (King of Hearts) = ? • p (ace) = ? • p (red ace) = ?
Number list 6, 6, 7, 7, 7, 7, 8, 8, 8, 9
Random Sample • Each individual in the population has an equal chance of being selected. • If more than one individual is selected, there must be constant probability for each and every selection.
What do we mean by a constant probability? • Imagine selecting two cards from a deck • First pick: P(Jack) = ? • Second pic: P(Jack) = ? (It depends) • Sampling with replacement (put the first card picked back in the deck)
Probabilities for a range of scores • In statistics we are often interested in computing probabilities for a range of scores from a distribution • For example what is the probability of a score greater than 4? • P(x > 4) = ? • P(x < 3) = ?
What is the probability of a score greater than 4? P(x > 4) = ? 3 2 frequency 1 X 1 2 3 4 5 6 7 8 P(x > 4) = .20
What is the probability of a score less than 3? P(x < 3) = ? 3 2 frequency 1 X 1 2 3 4 5 6 7 8 P(x < 3) = .30
What is the probability of a score less than 3 or greater than 4? P(x < 3 or x > 4) = ? 3 2 frequency 1 X 1 2 3 4 5 6 7 8 P(x < 3 or x > 4) = .50
So the proportion of area corresponding to a range of scores is the probability of selecting a score within that range
Normal Curve X µ
Normal Curve with percentages 34.13% 13.59% 13.59% 2.28% z -2 -1 0 +1 +2 µ
6.5 (a) Comparison of Curves = 6 X 68 74 80 µ (b) z 68 74 80 µ 0 +2.00
Curve broken down into + - 3 sd’s z -3 -2 -1 0 +1 +2 +3
Proportion in Tail vs. Body B Mean z C C Mean z
(a) (b) z z 1.0 0 0 1.5 µ µ (c) z -.5 0 µ Comparison of 3 curves
(b) z 0 0.35 1.40 µ (a) Comparison of 2 normal curves z -0.40 0 1.25 µ
Z-score formula in relation to probability z-score formula X Z Unit normal table Probability
If you select a score at random what is the probability of a score greater than 650? Normal curve with mean, 1 sd, and 2 z-scores = 100 ? X 500 650 µ z 0 1.50
If you select a score at random what is the probability of a score between 600 and 700? Normal curve with mean, 2 sd’s, and 3 z-scores = 100 ? X 600 500 700 µ z 0 1.00 2.00
Find the 85thpercentile score for this distribution Normal curve with top 15% shaded Lower 85% Top 15% = 100 X µ = 500 X = ? z 0 1.04 ? z scale
If you select a score at random what is the probability of a score less than 114? Curve with mean of 100, shaded below 114 = 10 X 114 µ = 100 z 0 1.40
If you select a score at random what is the probability of a score less than 92? Curve with mean of 100, shaded below 92 = 10 ? X 92 µ = 100 z -0.80 0
Find the 34thpercentile score for this distribution Curve with mean of 60, shaded below 34% P = 0.3400 or 34% = 5 X µ = 60 x = ?
Normal Curve with Quartiles 25% 25% 25% 25% z -0.67 0 +0.67 Q1 Q2 Q3 Quartiles
Probability of heads in two coin tosses 0.50 Probability 0.25 0 0 1 2 Number of heads in two coin tosses
(a) 0.375 Probability of heads in 4 & 6 coin tosses 0.250 Probability 0.125 0 1 2 3 4 Number of Heads in four coin tosses (b) 0.2500 0.1875 Probability 0.1250 0. 0625 0 1 2 3 4 5 6 Number of Heads in six coin tosses
The Relationship Between the Binomial Distribution and the Normal Distribution X 0 1 2 3 4 5 6 7 8 9 10