Download
1 / 21
220 likes | 383 Views
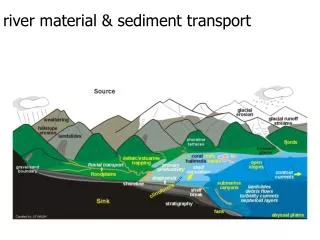
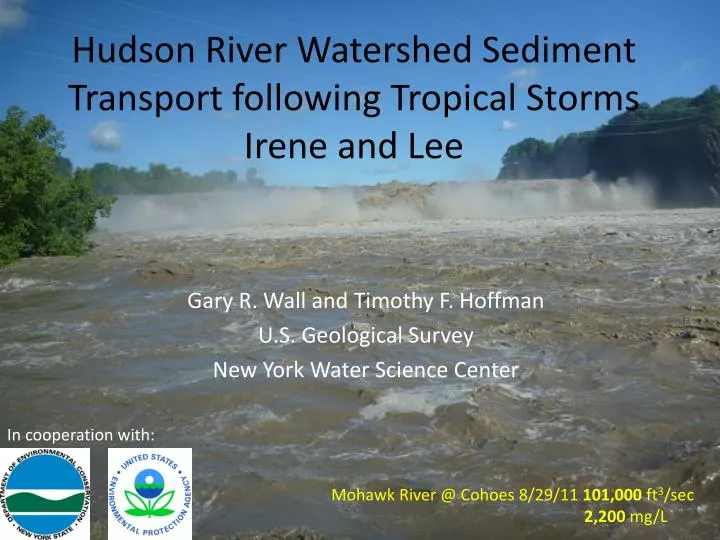
Hudson River Watershed Sediment Transport following Tropical Storms Irene and Lee. Gary R. Wall and Timothy F. Hoffman U.S. Geological Survey New York Water Science Center. In cooperation with:. Mohawk River @ Cohoes 8/29/11 101,000 ft 3 /sec 2,200 mg/L. Upper Hudson.

E N D
Hudson River Watershed Sediment Transport following Tropical Storms Irene and Lee Gary R. Wall and Timothy F. Hoffman U.S. Geological Survey New York Water Science Center In cooperation with: Mohawk River @ Cohoes 8/29/11 101,000 ft3/sec 2,200 mg/L
Upper Hudson USGS Suspended-Sediment Monitoring Stations Mohawk Normanskill Kinderhook Catskill RoJan Rondout Poughkeepsie
Upper Hudson USGS Suspended-Sediment Monitoring Stations Mohawk Normanskill Kinderhook Catskill RoJan Esopus Rondout Poughkeepsie
Methodology • River Discharge x Sediment Concentration = Mass of sediment per unit time (Tons/day) • Need a continuous record of both • USGS stream gages provide continuous discharge • High frequency sampling or a continuous surrogate provide sediment concentration
Methodology • High-frequency sampling
Methodology • Surrogate Catskill Rondout Log10 Suspended Sediment Concentration Kinderhook Roeliff Jansen Log10 Turbidity
Head-of-Tide Results Schoharie Creek Mohawk River
How much is 1.75 million tons of sediment? This truck can carry 400 tons…
Cary Institute 4,375 trucks Bumper-to-bumper Both directions
Lower Hudson Tributary Results Catskill Creek near Catskill 9/7/11 – 29,000 ft3/sec ~1,700 mg/L
Lower Hudson Tributary Loads * Irene only
Tributary Yields * Irene only
Upper Hudson Mohawk Normanskill Kinderhook Catskill National Weather Service Radar-Based Precipitation Estimates for TS Irene RoJan Esopus Rondout Poughkeepsie Gage
Poughkeepsie Results Concentration x Discharge = 1 million tons of suspended sediment through mid-October 2011
Green Island Dam 1.75 million tons West-of-Hudson tributaries 95,000 tons ~1.75 million tons trapped 900,000 tons East-of-Hudson tributaries Poughkeepsie 1 million tons
Hudson River near Poughkeepsie 8/30/11 Net Discharge = 170,000 ft3/sec , 248mg/L Acknowledgements: • DEC Hudson River Estuary Program and Div. of Water • EPA Harbor Estuary Program • NEIWPCC • Stuart Findlay – Cary Institute • Randy Alstadt – City of Poughkeepsie • Hudson River Foundation • HRECOS • National Weather Service