Download
1 / 41
430 likes | 1.13k Views
Development of the Neuse Estuary Eutrophication Model: Background and Calibration By James D. Bowen UNC Charlotte Neuse River Estuary Model Pamlico Sound Applied Water Quality Modeling Research Neuse Estuary Neuse River Estuary Facts About the Neuse River

E N D
Development of the Neuse Estuary Eutrophication Model: Background and Calibration By James D. Bowen UNC Charlotte
Neuse River Estuary Model Pamlico Sound Applied Water Quality Modeling Research Neuse Estuary
Facts About the Neuse River • 3rd Largest River Basin in NC (6,234 mi2) • 200 miles long, 3000 stream miles • Estuary in lower 50 miles • 1.5 million people in basin, mostly near headwaters • Nutrient loading has doubled since 70’s
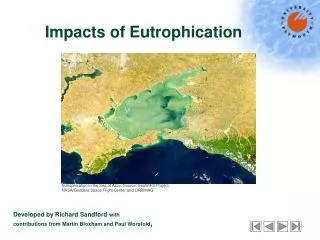
Neuse River Problems: Algal Blooms Blue-GreenAlgae Bloom near New Bern
Neuse River Problems: Low DO 1997 Bottom Water DO Conc.
Low DO and Fish Kills: 94-96 Cherry Point Streets Ferry
Water Quality Research Project MODMON = MODeling and MONitoring • Interdisciplinary Applied Research • Water Quality and Biological Monitoring • Water Quality Modeling to predict w.q. improvement (30% nutr. red.)
Physical Processes Neuse EstuaryEutrophicationModel
Neuse EstuaryEutrophicationModel Water Column Biological Processes
Benthic/Water- Column Interactions Neuse EstuaryEutrophicationModel
Special Features of Modeling Unusually challenging system to model • intermittent, weak stratification (wind driven) • no strong tidal forcing • sediments have important effects on nutrient and DO dynamics • blooms of several different phytoplankton groups @ different times and places
Neuse Estuary Eutrophication Model • based upon 2-d laterally averaged model CE-Qual-W2 • Nutrient, phytoplankton, organic matter, DO model • 3 phytoplankton groups (V.3) • summer assemblage, diatoms, dinoflagellates
1 m /mmax 0 Light, Nutrients W2 Phytoplankton Growth Model 1 T.R.M. 0 Topt Temperature m = mmax * min(m / mmax) * T.R.M.
S1 S1 S2 S2 S3 S3 S4 W2 X-section Representation • trapezoidal cross-sections for each segment Layer 1 Layer 4 Sediment Compartments • quasi-3d sediment/water-column interaction model
W2 Sediment Submodel • simple sediment diagenesis model • 1 constituent: Sediment organic carbon (SOC) • SOC fate processes: • redistribution, decomposition • SOD decomposition rate determines fluxes: • O2 demand, PO4 release, NH3 release • N, P, S, Fe redox reactions not considered • e.g. NH3/NO3, NO3/N2, SO4/H2S • can simulate sediment “clean-up”
1991 Simulation Description • Time Period: • March 1 - September 27, 1991 • Boundary Data Frequency • Daily Flow and NO3, monthly WQ • Hydrodynamic Calibration Data • hrly. water elevations, salinities, velocities @ 3 estuary stations • WQ Calibration Data • monthly mid-water nutrients, DO, chl-a @ 4 estuary stations
Inflow N/P molar ratio - 1991 Redfield Ratio
Other Model Characteristics • 62 horizontal segments, 18 layers • execution time step = 10 min. • 2 branches: Neuse & Trent Rivers • 12 tributaries: 9 creeks, 3 WWTP’s • 16 state variables • Boundary Conditions: Flow @ Streets Ferry, Elevation @ Oriental
Neuse Estuary Model Results Transport Model • Water elevations • time histories • spectral analysis • Salinity distributions • time histories @ one segment • animations
Elevations @ Cherry Point Observed Model March April May
Water Level @ New Bern MAE = 0.1 m Julian Day
Elev. Fluctuations - Power Spectrum Observed @ Cherry Point n = 0.020 Amplitude (m) Model Frequency (Cycles/day)
0 4 8 12 16 Salinities @ Cherry Point Model: Surface Observed: Top Bottom Salinity (ppth) Model: Bottom May Sep Mar July
WQ Conditions: Summary • Seasonal/Spatial Trends • nutrients decreasing downstream • April mid-estuary phytoplankton bloom • June upper-estuary phytoplankton bloom • several pulses of high NOx conc. @ New Bern • August high-flow event • high nutrients, low chl-a @ New Bern • high Sept. chl-a @ New Bern
1991 WQ Simulations • Single parameter displays • Nitrate • Phytoplankton • Cumulative chl-a • Multi-parameter display • New Bern time history
Sal. NOx DO Chl Water Quality Prediction - New Bern 0 Surface Middle 6 .5 0 Surface 10 Middle 4 50 0 May Sep Mar July
Calibration Summary • Transport Model • elevation variations predicted within 0.1 m • salinity variations within 2 ppth • dynamics nicely represented • Water Quality Model • blooms of phytoplankton well represented • seasonal variations also represented • New Bern chl-a shows influence of physical processes
Summary, continued • Water Quality Model • DO dynamics fit expectations based on 1997 monitoring • Overall model performance • consistent with previous modeling efforts • sufficient for water quality improvement predictions